Bulgarian vs Immigrants from Trinidad and Tobago In Labor Force | Age 35-44
COMPARE
Bulgarian
Immigrants from Trinidad and Tobago
In Labor Force | Age 35-44
In Labor Force | Age 35-44 Comparison
Bulgarians
Immigrants from Trinidad and Tobago
85.5%
IN LABOR FORCE | AGE 35-44
100.0/ 100
METRIC RATING
21st/ 347
METRIC RANK
84.4%
IN LABOR FORCE | AGE 35-44
50.7/ 100
METRIC RATING
173rd/ 347
METRIC RANK
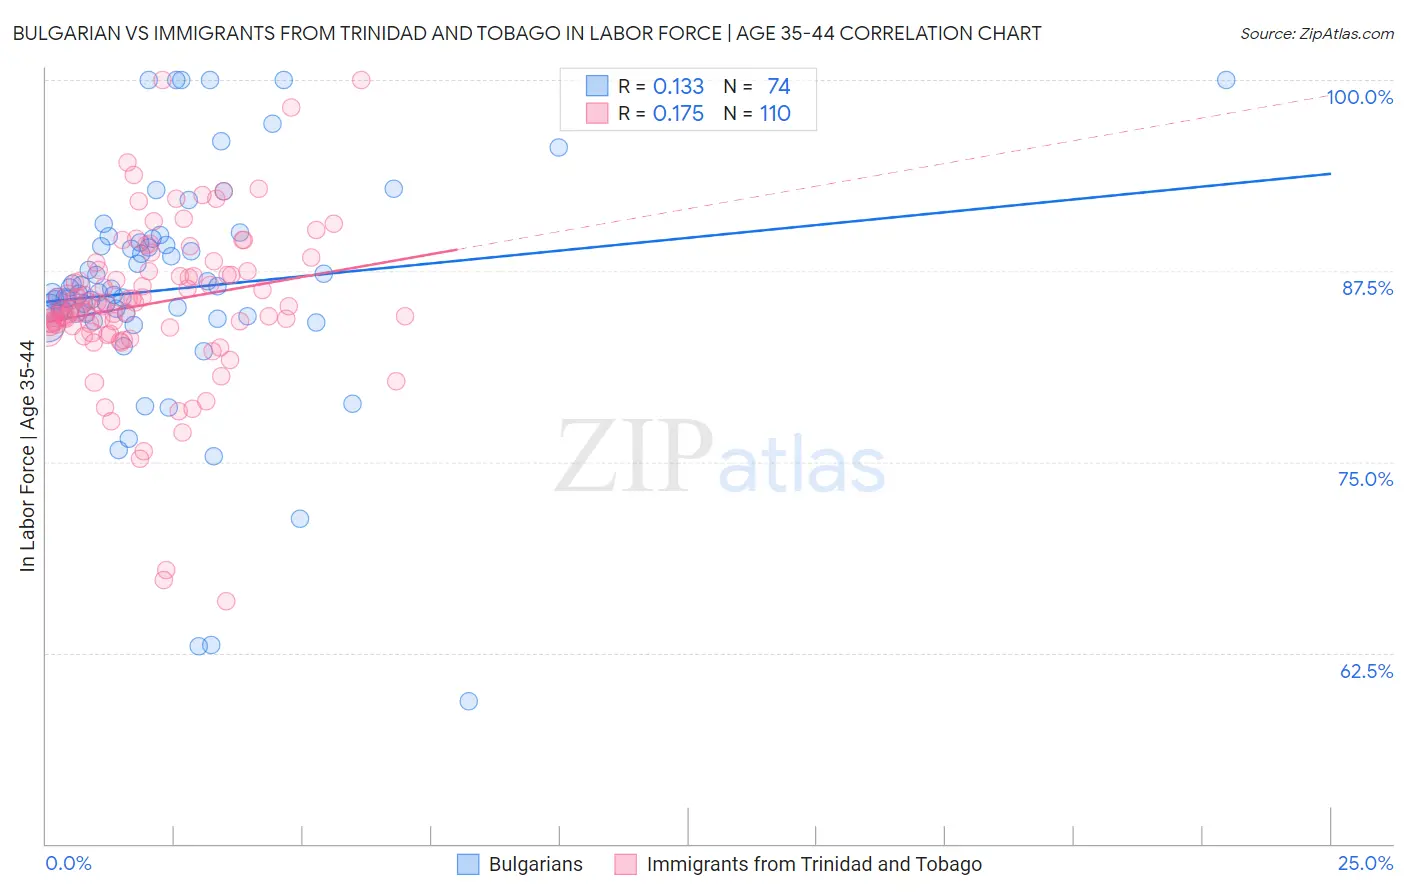
Bulgarian vs Immigrants from Trinidad and Tobago In Labor Force | Age 35-44 Correlation Chart
The statistical analysis conducted on geographies consisting of 205,570,158 people shows a poor positive correlation between the proportion of Bulgarians and labor force participation rate among population between the ages 35 and 44 in the United States with a correlation coefficient (R) of 0.133 and weighted average of 85.5%. Similarly, the statistical analysis conducted on geographies consisting of 223,496,330 people shows a poor positive correlation between the proportion of Immigrants from Trinidad and Tobago and labor force participation rate among population between the ages 35 and 44 in the United States with a correlation coefficient (R) of 0.175 and weighted average of 84.4%, a difference of 1.3%.
In Labor Force | Age 35-44 Correlation Summary
| Measurement | Bulgarian | Immigrants from Trinidad and Tobago |
| Minimum | 59.3% | 65.9% |
| Maximum | 100.0% | 100.0% |
| Range | 40.7% | 34.1% |
| Mean | 86.3% | 85.4% |
| Median | 86.0% | 85.2% |
| Interquartile 25% (IQ1) | 84.7% | 83.8% |
| Interquartile 75% (IQ3) | 89.4% | 87.5% |
| Interquartile Range (IQR) | 4.7% | 3.7% |
| Standard Deviation (Sample) | 7.7% | 5.3% |
| Standard Deviation (Population) | 7.7% | 5.3% |
Similar Demographics by In Labor Force | Age 35-44
Demographics Similar to Bulgarians by In Labor Force | Age 35-44
In terms of in labor force | age 35-44, the demographic groups most similar to Bulgarians are Immigrants from Bosnia and Herzegovina (85.4%, a difference of 0.040%), Immigrants from Serbia (85.5%, a difference of 0.060%), Immigrants from Eastern Africa (85.4%, a difference of 0.060%), Carpatho Rusyn (85.6%, a difference of 0.10%), and Slovene (85.6%, a difference of 0.10%).
| Demographics | Rating | Rank | In Labor Force | Age 35-44 |
| Immigrants | Somalia | 100.0 /100 | #14 | Exceptional 85.6% |
| Norwegians | 100.0 /100 | #15 | Exceptional 85.6% |
| Immigrants | Ireland | 100.0 /100 | #16 | Exceptional 85.6% |
| Immigrants | North Macedonia | 100.0 /100 | #17 | Exceptional 85.6% |
| Carpatho Rusyns | 100.0 /100 | #18 | Exceptional 85.6% |
| Slovenes | 100.0 /100 | #19 | Exceptional 85.6% |
| Immigrants | Serbia | 100.0 /100 | #20 | Exceptional 85.5% |
| Bulgarians | 100.0 /100 | #21 | Exceptional 85.5% |
| Immigrants | Bosnia and Herzegovina | 100.0 /100 | #22 | Exceptional 85.4% |
| Immigrants | Eastern Africa | 100.0 /100 | #23 | Exceptional 85.4% |
| Latvians | 99.9 /100 | #24 | Exceptional 85.4% |
| Paraguayans | 99.9 /100 | #25 | Exceptional 85.4% |
| Immigrants | Liberia | 99.9 /100 | #26 | Exceptional 85.4% |
| Immigrants | Lithuania | 99.9 /100 | #27 | Exceptional 85.4% |
| Immigrants | Greece | 99.9 /100 | #28 | Exceptional 85.3% |
Demographics Similar to Immigrants from Trinidad and Tobago by In Labor Force | Age 35-44
In terms of in labor force | age 35-44, the demographic groups most similar to Immigrants from Trinidad and Tobago are Scandinavian (84.4%, a difference of 0.0%), Immigrants from Iran (84.4%, a difference of 0.0%), Immigrants from Afghanistan (84.4%, a difference of 0.010%), Immigrants from Jordan (84.4%, a difference of 0.010%), and Jordanian (84.4%, a difference of 0.010%).
| Demographics | Rating | Rank | In Labor Force | Age 35-44 |
| Alsatians | 55.2 /100 | #166 | Average 84.4% |
| Immigrants | Portugal | 55.2 /100 | #167 | Average 84.4% |
| Irish | 53.1 /100 | #168 | Average 84.4% |
| Immigrants | Afghanistan | 52.7 /100 | #169 | Average 84.4% |
| Immigrants | Jordan | 52.5 /100 | #170 | Average 84.4% |
| Jordanians | 51.7 /100 | #171 | Average 84.4% |
| Scandinavians | 51.2 /100 | #172 | Average 84.4% |
| Immigrants | Trinidad and Tobago | 50.7 /100 | #173 | Average 84.4% |
| Immigrants | Iran | 50.0 /100 | #174 | Average 84.4% |
| Pakistanis | 48.2 /100 | #175 | Average 84.4% |
| Sri Lankans | 47.3 /100 | #176 | Average 84.4% |
| French Canadians | 44.3 /100 | #177 | Average 84.3% |
| Northern Europeans | 44.1 /100 | #178 | Average 84.3% |
| Immigrants | South Africa | 42.8 /100 | #179 | Average 84.3% |
| Danes | 38.8 /100 | #180 | Fair 84.3% |