British West Indian vs Immigrants from Caribbean In Labor Force | Age > 16
COMPARE
British West Indian
Immigrants from Caribbean
In Labor Force | Age > 16
In Labor Force | Age > 16 Comparison
British West Indians
Immigrants from Caribbean
64.4%
IN LABOR FORCE | AGE > 16
1.8/ 100
METRIC RATING
250th/ 347
METRIC RANK
64.4%
IN LABOR FORCE | AGE > 16
2.3/ 100
METRIC RATING
246th/ 347
METRIC RANK
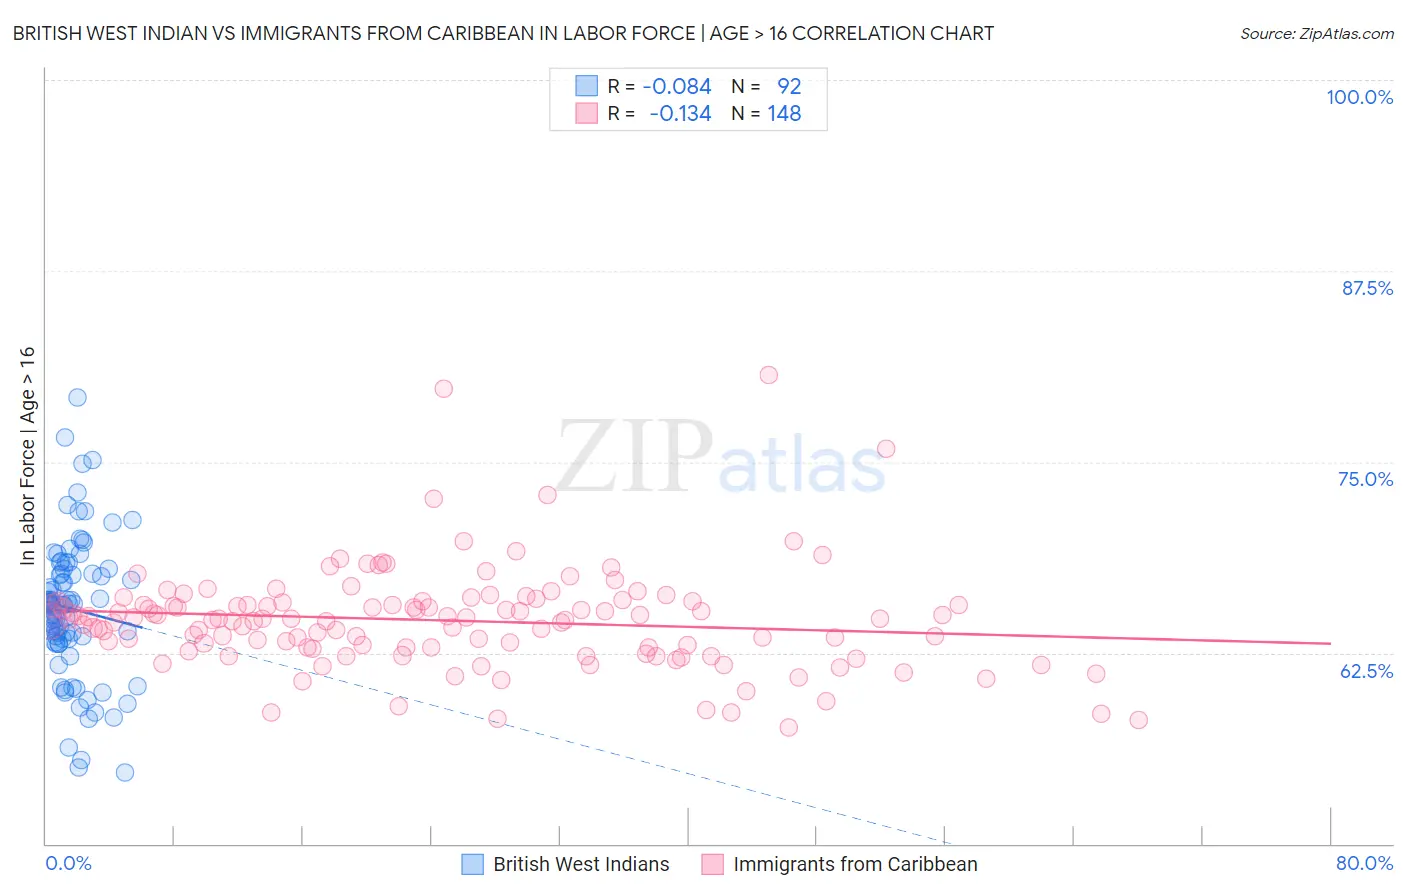
British West Indian vs Immigrants from Caribbean In Labor Force | Age > 16 Correlation Chart
The statistical analysis conducted on geographies consisting of 152,701,183 people shows a slight negative correlation between the proportion of British West Indians and labor force participation rate among population ages 16 and over in the United States with a correlation coefficient (R) of -0.084 and weighted average of 64.4%. Similarly, the statistical analysis conducted on geographies consisting of 450,044,170 people shows a poor negative correlation between the proportion of Immigrants from Caribbean and labor force participation rate among population ages 16 and over in the United States with a correlation coefficient (R) of -0.134 and weighted average of 64.4%, a difference of 0.070%.
In Labor Force | Age > 16 Correlation Summary
| Measurement | British West Indian | Immigrants from Caribbean |
| Minimum | 54.7% | 57.6% |
| Maximum | 79.2% | 80.7% |
| Range | 24.5% | 23.1% |
| Mean | 65.4% | 64.6% |
| Median | 65.7% | 64.7% |
| Interquartile 25% (IQ1) | 63.3% | 62.8% |
| Interquartile 75% (IQ3) | 67.8% | 65.8% |
| Interquartile Range (IQR) | 4.6% | 3.0% |
| Standard Deviation (Sample) | 4.6% | 3.4% |
| Standard Deviation (Population) | 4.5% | 3.3% |
Demographics Similar to British West Indians and Immigrants from Caribbean by In Labor Force | Age > 16
In terms of in labor force | age > 16, the demographic groups most similar to British West Indians are German (64.4%, a difference of 0.010%), Portuguese (64.4%, a difference of 0.020%), Immigrants from Barbados (64.4%, a difference of 0.040%), Swiss (64.4%, a difference of 0.050%), and Immigrants from Dominican Republic (64.4%, a difference of 0.050%). Similarly, the demographic groups most similar to Immigrants from Caribbean are Swiss (64.4%, a difference of 0.020%), Immigrants from Barbados (64.4%, a difference of 0.030%), German (64.4%, a difference of 0.060%), West Indian (64.5%, a difference of 0.080%), and Tsimshian (64.5%, a difference of 0.090%).
| Demographics | Rating | Rank | In Labor Force | Age > 16 |
| Lebanese | 3.9 /100 | #238 | Tragic 64.5% |
| Immigrants | Hungary | 3.8 /100 | #239 | Tragic 64.5% |
| Immigrants | Bangladesh | 3.6 /100 | #240 | Tragic 64.5% |
| Immigrants | Dominica | 3.5 /100 | #241 | Tragic 64.5% |
| Immigrants | Netherlands | 3.4 /100 | #242 | Tragic 64.5% |
| Immigrants | Lebanon | 3.2 /100 | #243 | Tragic 64.5% |
| Tsimshian | 3.1 /100 | #244 | Tragic 64.5% |
| West Indians | 3.0 /100 | #245 | Tragic 64.5% |
| Immigrants | Caribbean | 2.3 /100 | #246 | Tragic 64.4% |
| Swiss | 2.1 /100 | #247 | Tragic 64.4% |
| Immigrants | Barbados | 2.1 /100 | #248 | Tragic 64.4% |
| Germans | 1.8 /100 | #249 | Tragic 64.4% |
| British West Indians | 1.8 /100 | #250 | Tragic 64.4% |
| Portuguese | 1.6 /100 | #251 | Tragic 64.4% |
| Immigrants | Dominican Republic | 1.5 /100 | #252 | Tragic 64.4% |
| Czechoslovakians | 1.4 /100 | #253 | Tragic 64.3% |
| Immigrants | Uzbekistan | 1.4 /100 | #254 | Tragic 64.3% |
| Hispanics or Latinos | 1.1 /100 | #255 | Tragic 64.3% |
| Immigrants | Mexico | 1.0 /100 | #256 | Tragic 64.3% |
| Inupiat | 0.8 /100 | #257 | Tragic 64.3% |
| Immigrants | Scotland | 0.8 /100 | #258 | Tragic 64.2% |