British West Indian vs Kiowa Ambulatory Disability
COMPARE
British West Indian
Kiowa
Ambulatory Disability
Ambulatory Disability Comparison
British West Indians
Kiowa
7.0%
AMBULATORY DISABILITY
0.0/ 100
METRIC RATING
301st/ 347
METRIC RANK
8.6%
AMBULATORY DISABILITY
0.0/ 100
METRIC RATING
342nd/ 347
METRIC RANK
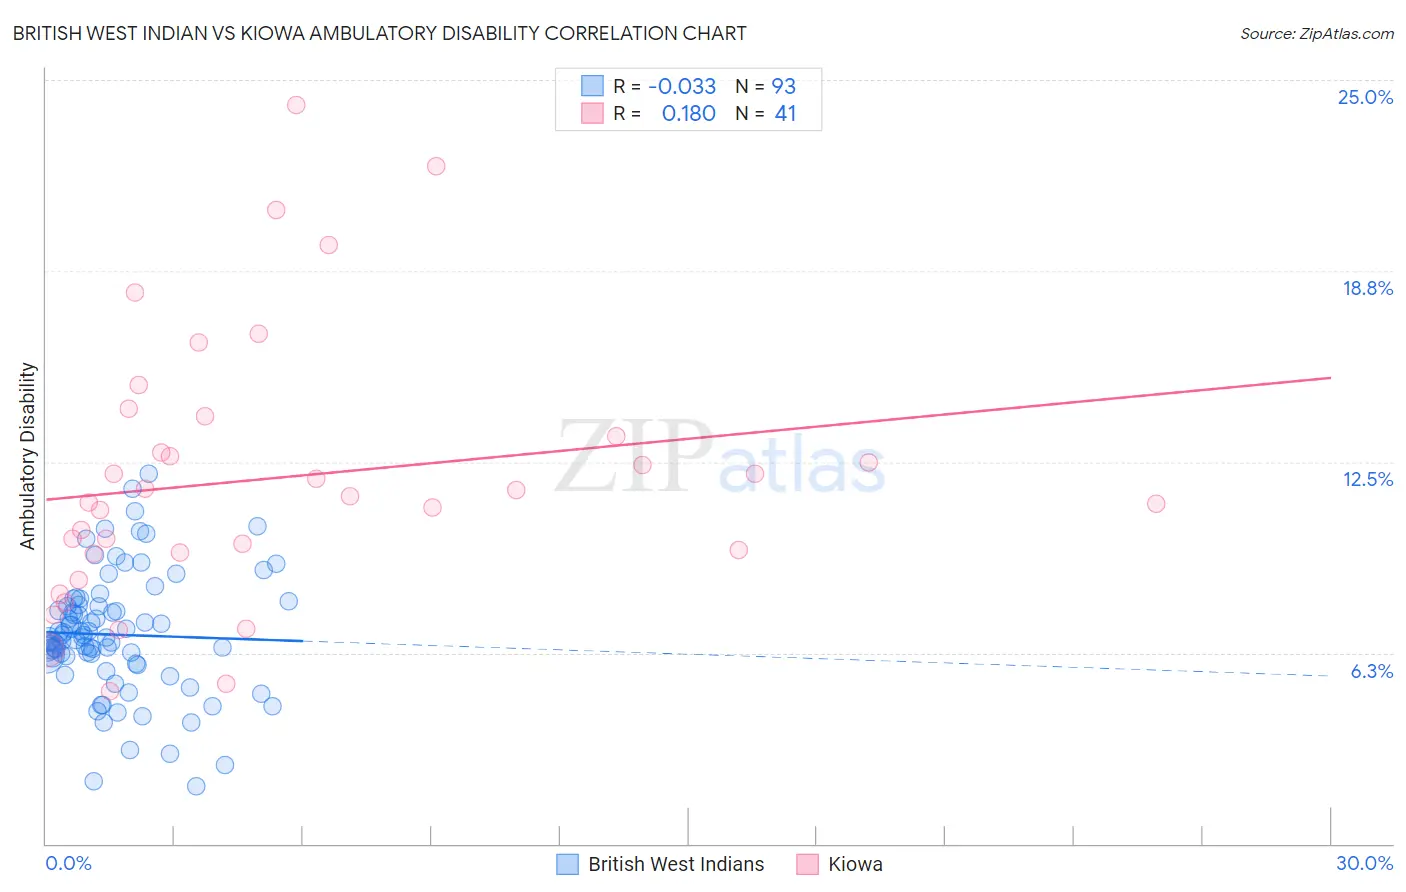
British West Indian vs Kiowa Ambulatory Disability Correlation Chart
The statistical analysis conducted on geographies consisting of 152,684,150 people shows no correlation between the proportion of British West Indians and percentage of population with ambulatory disability in the United States with a correlation coefficient (R) of -0.033 and weighted average of 7.0%. Similarly, the statistical analysis conducted on geographies consisting of 56,098,289 people shows a poor positive correlation between the proportion of Kiowa and percentage of population with ambulatory disability in the United States with a correlation coefficient (R) of 0.180 and weighted average of 8.6%, a difference of 23.6%.
Ambulatory Disability Correlation Summary
| Measurement | British West Indian | Kiowa |
| Minimum | 1.9% | 5.0% |
| Maximum | 12.1% | 24.2% |
| Range | 10.2% | 19.2% |
| Mean | 6.8% | 12.0% |
| Median | 6.8% | 11.4% |
| Interquartile 25% (IQ1) | 6.0% | 9.5% |
| Interquartile 75% (IQ3) | 7.8% | 13.7% |
| Interquartile Range (IQR) | 1.8% | 4.2% |
| Standard Deviation (Sample) | 2.0% | 4.4% |
| Standard Deviation (Population) | 2.0% | 4.3% |
Similar Demographics by Ambulatory Disability
Demographics Similar to British West Indians by Ambulatory Disability
In terms of ambulatory disability, the demographic groups most similar to British West Indians are Immigrants from Armenia (7.0%, a difference of 0.060%), African (7.0%, a difference of 0.11%), Marshallese (6.9%, a difference of 0.23%), Puget Sound Salish (6.9%, a difference of 0.24%), and Immigrants from Grenada (6.9%, a difference of 0.37%).
| Demographics | Rating | Rank | Ambulatory Disability |
| Cape Verdeans | 0.0 /100 | #294 | Tragic 6.9% |
| Crow | 0.0 /100 | #295 | Tragic 6.9% |
| Alaskan Athabascans | 0.0 /100 | #296 | Tragic 6.9% |
| French American Indians | 0.0 /100 | #297 | Tragic 6.9% |
| Immigrants | Grenada | 0.0 /100 | #298 | Tragic 6.9% |
| Puget Sound Salish | 0.0 /100 | #299 | Tragic 6.9% |
| Marshallese | 0.0 /100 | #300 | Tragic 6.9% |
| British West Indians | 0.0 /100 | #301 | Tragic 7.0% |
| Immigrants | Armenia | 0.0 /100 | #302 | Tragic 7.0% |
| Africans | 0.0 /100 | #303 | Tragic 7.0% |
| Immigrants | Cabo Verde | 0.0 /100 | #304 | Tragic 7.0% |
| Immigrants | Micronesia | 0.0 /100 | #305 | Tragic 7.0% |
| Iroquois | 0.0 /100 | #306 | Tragic 7.1% |
| Spanish Americans | 0.0 /100 | #307 | Tragic 7.1% |
| Chippewa | 0.0 /100 | #308 | Tragic 7.1% |
Demographics Similar to Kiowa by Ambulatory Disability
In terms of ambulatory disability, the demographic groups most similar to Kiowa are Tohono O'odham (8.7%, a difference of 1.5%), Creek (8.5%, a difference of 1.9%), Tsimshian (8.8%, a difference of 2.5%), Puerto Rican (8.9%, a difference of 3.1%), and Choctaw (8.3%, a difference of 3.5%).
| Demographics | Rating | Rank | Ambulatory Disability |
| Cherokee | 0.0 /100 | #333 | Tragic 7.9% |
| Yuman | 0.0 /100 | #334 | Tragic 7.9% |
| Chickasaw | 0.0 /100 | #335 | Tragic 8.0% |
| Seminole | 0.0 /100 | #336 | Tragic 8.0% |
| Dutch West Indians | 0.0 /100 | #337 | Tragic 8.2% |
| Colville | 0.0 /100 | #338 | Tragic 8.2% |
| Pima | 0.0 /100 | #339 | Tragic 8.2% |
| Choctaw | 0.0 /100 | #340 | Tragic 8.3% |
| Creek | 0.0 /100 | #341 | Tragic 8.5% |
| Kiowa | 0.0 /100 | #342 | Tragic 8.6% |
| Tohono O'odham | 0.0 /100 | #343 | Tragic 8.7% |
| Tsimshian | 0.0 /100 | #344 | Tragic 8.8% |
| Puerto Ricans | 0.0 /100 | #345 | Tragic 8.9% |
| Houma | 0.0 /100 | #346 | Tragic 9.3% |
| Lumbee | 0.0 /100 | #347 | Tragic 9.5% |