Shoshone vs Puget Sound Salish In Labor Force | Age 35-44
COMPARE
Shoshone
Puget Sound Salish
In Labor Force | Age 35-44
In Labor Force | Age 35-44 Comparison
Shoshone
Puget Sound Salish
82.2%
IN LABOR FORCE | AGE 35-44
0.0/ 100
METRIC RATING
305th/ 347
METRIC RANK
82.9%
IN LABOR FORCE | AGE 35-44
0.0/ 100
METRIC RATING
288th/ 347
METRIC RANK
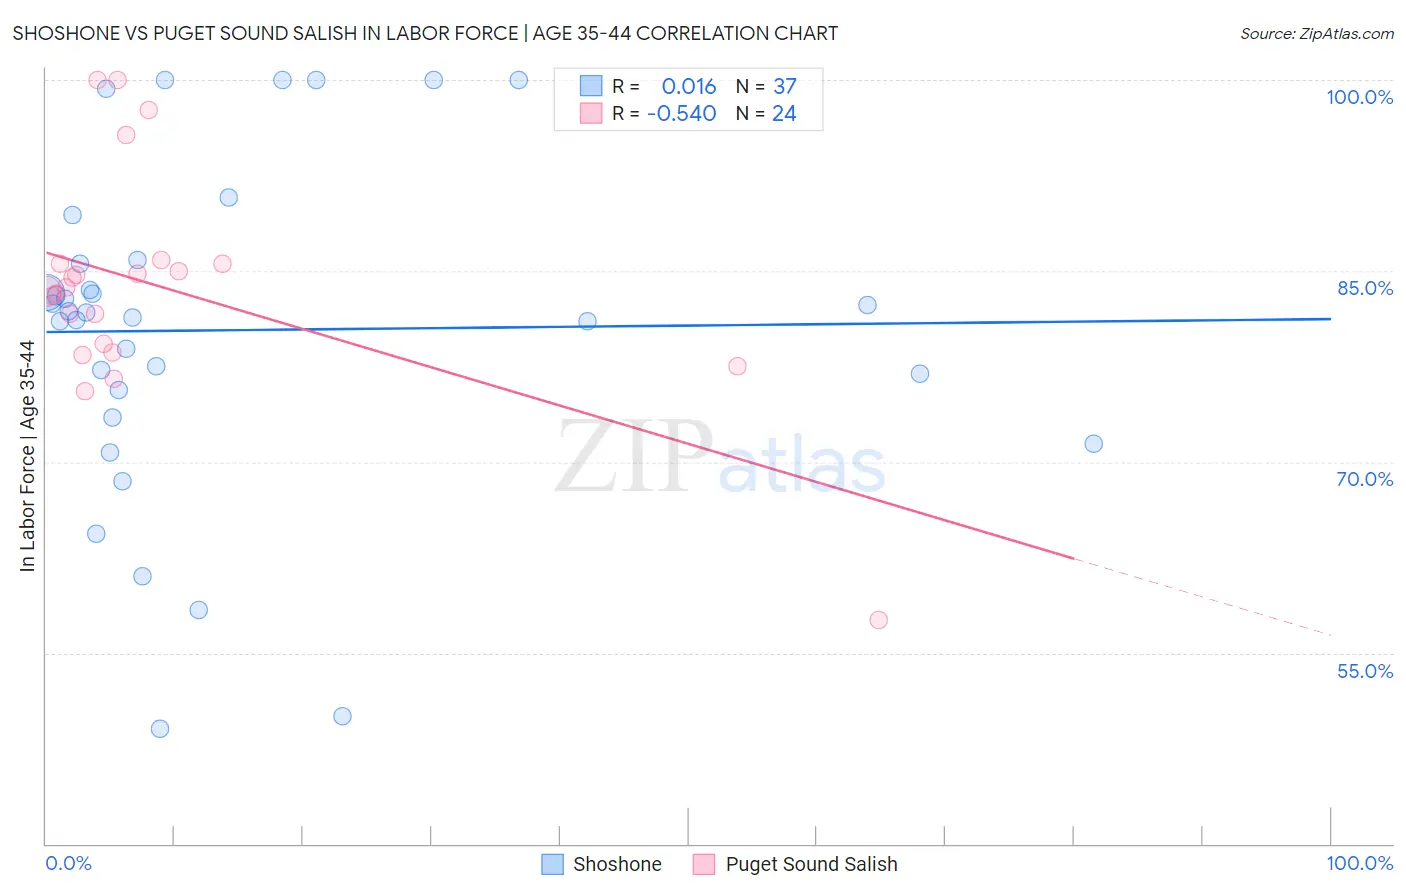
Shoshone vs Puget Sound Salish In Labor Force | Age 35-44 Correlation Chart
The statistical analysis conducted on geographies consisting of 66,624,139 people shows no correlation between the proportion of Shoshone and labor force participation rate among population between the ages 35 and 44 in the United States with a correlation coefficient (R) of 0.016 and weighted average of 82.2%. Similarly, the statistical analysis conducted on geographies consisting of 46,155,509 people shows a substantial negative correlation between the proportion of Puget Sound Salish and labor force participation rate among population between the ages 35 and 44 in the United States with a correlation coefficient (R) of -0.540 and weighted average of 82.9%, a difference of 0.89%.
In Labor Force | Age 35-44 Correlation Summary
| Measurement | Shoshone | Puget Sound Salish |
| Minimum | 49.0% | 57.6% |
| Maximum | 100.0% | 100.0% |
| Range | 51.0% | 42.4% |
| Mean | 80.3% | 83.7% |
| Median | 81.7% | 83.6% |
| Interquartile 25% (IQ1) | 74.6% | 78.9% |
| Interquartile 75% (IQ3) | 85.7% | 85.6% |
| Interquartile Range (IQR) | 11.1% | 6.6% |
| Standard Deviation (Sample) | 12.9% | 8.9% |
| Standard Deviation (Population) | 12.8% | 8.7% |
Demographics Similar to Shoshone and Puget Sound Salish by In Labor Force | Age 35-44
In terms of in labor force | age 35-44, the demographic groups most similar to Shoshone are Black/African American (82.2%, a difference of 0.020%), Marshallese (82.4%, a difference of 0.27%), American (82.4%, a difference of 0.28%), Nepalese (82.4%, a difference of 0.28%), and Spanish American Indian (82.5%, a difference of 0.35%). Similarly, the demographic groups most similar to Puget Sound Salish are Chippewa (82.9%, a difference of 0.010%), Immigrants from Bangladesh (82.9%, a difference of 0.020%), Immigrants from Belize (82.9%, a difference of 0.020%), African (82.9%, a difference of 0.030%), and Pennsylvania German (82.9%, a difference of 0.040%).
| Demographics | Rating | Rank | In Labor Force | Age 35-44 |
| Immigrants | Bangladesh | 0.0 /100 | #286 | Tragic 82.9% |
| Immigrants | Belize | 0.0 /100 | #287 | Tragic 82.9% |
| Puget Sound Salish | 0.0 /100 | #288 | Tragic 82.9% |
| Chippewa | 0.0 /100 | #289 | Tragic 82.9% |
| Africans | 0.0 /100 | #290 | Tragic 82.9% |
| Pennsylvania Germans | 0.0 /100 | #291 | Tragic 82.9% |
| Immigrants | Latin America | 0.0 /100 | #292 | Tragic 82.8% |
| Spanish Americans | 0.0 /100 | #293 | Tragic 82.8% |
| Potawatomi | 0.0 /100 | #294 | Tragic 82.7% |
| Immigrants | Lebanon | 0.0 /100 | #295 | Tragic 82.7% |
| Mexican American Indians | 0.0 /100 | #296 | Tragic 82.6% |
| Hmong | 0.0 /100 | #297 | Tragic 82.6% |
| Ottawa | 0.0 /100 | #298 | Tragic 82.6% |
| Tlingit-Haida | 0.0 /100 | #299 | Tragic 82.5% |
| Central American Indians | 0.0 /100 | #300 | Tragic 82.5% |
| Spanish American Indians | 0.0 /100 | #301 | Tragic 82.5% |
| Americans | 0.0 /100 | #302 | Tragic 82.4% |
| Nepalese | 0.0 /100 | #303 | Tragic 82.4% |
| Marshallese | 0.0 /100 | #304 | Tragic 82.4% |
| Shoshone | 0.0 /100 | #305 | Tragic 82.2% |
| Blacks/African Americans | 0.0 /100 | #306 | Tragic 82.2% |