Iroquois vs Puget Sound Salish In Labor Force | Age 35-44
COMPARE
Iroquois
Puget Sound Salish
In Labor Force | Age 35-44
In Labor Force | Age 35-44 Comparison
Iroquois
Puget Sound Salish
83.5%
IN LABOR FORCE | AGE 35-44
0.2/ 100
METRIC RATING
263rd/ 347
METRIC RANK
82.9%
IN LABOR FORCE | AGE 35-44
0.0/ 100
METRIC RATING
288th/ 347
METRIC RANK
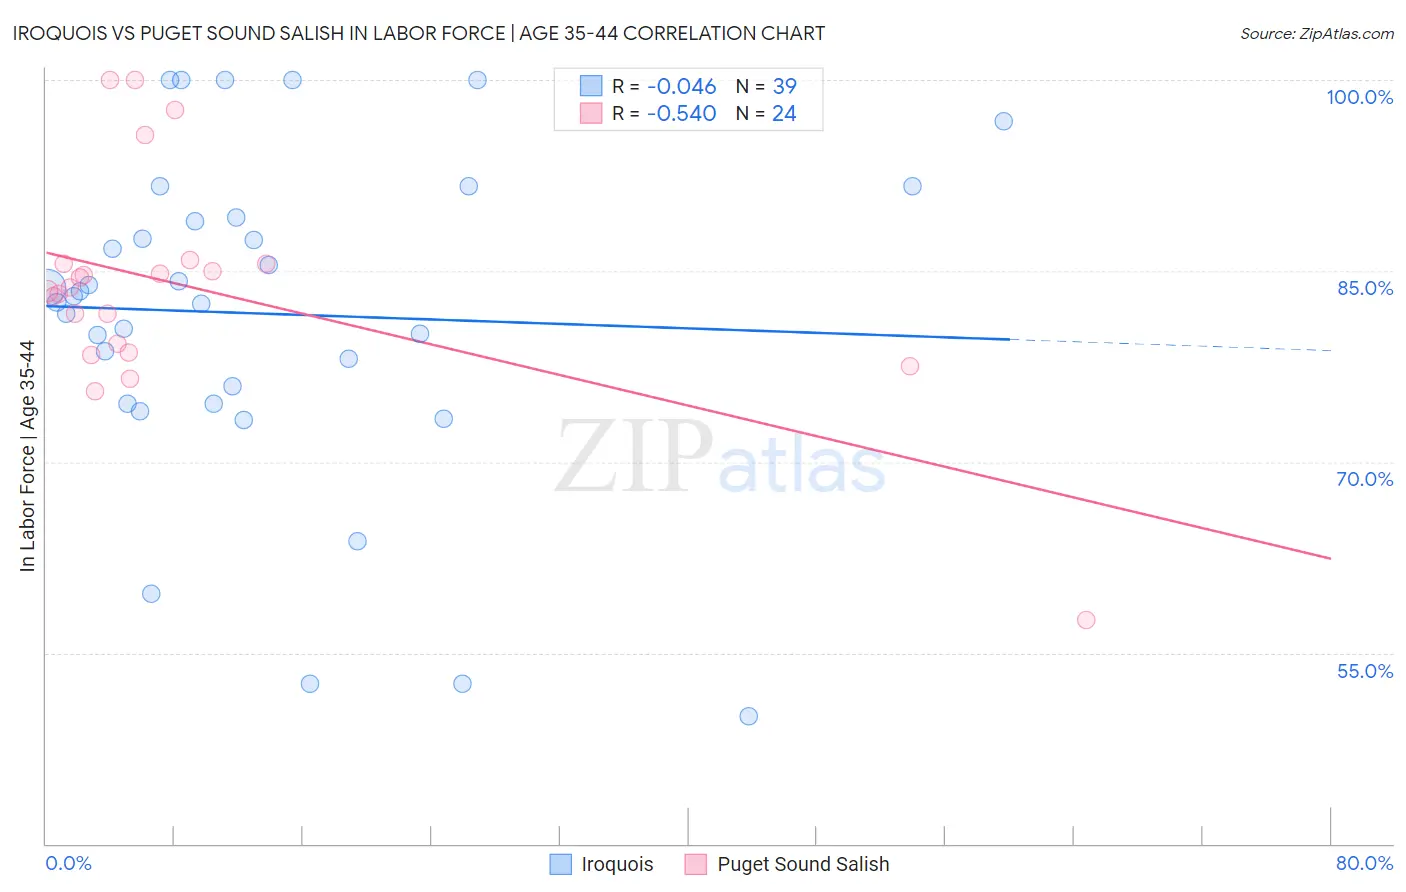
Iroquois vs Puget Sound Salish In Labor Force | Age 35-44 Correlation Chart
The statistical analysis conducted on geographies consisting of 207,246,504 people shows no correlation between the proportion of Iroquois and labor force participation rate among population between the ages 35 and 44 in the United States with a correlation coefficient (R) of -0.046 and weighted average of 83.5%. Similarly, the statistical analysis conducted on geographies consisting of 46,155,509 people shows a substantial negative correlation between the proportion of Puget Sound Salish and labor force participation rate among population between the ages 35 and 44 in the United States with a correlation coefficient (R) of -0.540 and weighted average of 82.9%, a difference of 0.69%.
In Labor Force | Age 35-44 Correlation Summary
| Measurement | Iroquois | Puget Sound Salish |
| Minimum | 50.0% | 57.6% |
| Maximum | 100.0% | 100.0% |
| Range | 50.0% | 42.4% |
| Mean | 81.6% | 83.7% |
| Median | 83.1% | 83.6% |
| Interquartile 25% (IQ1) | 74.6% | 78.9% |
| Interquartile 75% (IQ3) | 89.2% | 85.6% |
| Interquartile Range (IQR) | 14.6% | 6.6% |
| Standard Deviation (Sample) | 12.9% | 8.9% |
| Standard Deviation (Population) | 12.7% | 8.7% |
Similar Demographics by In Labor Force | Age 35-44
Demographics Similar to Iroquois by In Labor Force | Age 35-44
In terms of in labor force | age 35-44, the demographic groups most similar to Iroquois are Immigrants from Dominica (83.5%, a difference of 0.030%), Immigrants from Congo (83.5%, a difference of 0.030%), Scotch-Irish (83.5%, a difference of 0.030%), Vietnamese (83.5%, a difference of 0.040%), and Central American (83.5%, a difference of 0.040%).
| Demographics | Rating | Rank | In Labor Force | Age 35-44 |
| Japanese | 0.3 /100 | #256 | Tragic 83.6% |
| Basques | 0.3 /100 | #257 | Tragic 83.6% |
| Tsimshian | 0.2 /100 | #258 | Tragic 83.5% |
| Immigrants | El Salvador | 0.2 /100 | #259 | Tragic 83.5% |
| Vietnamese | 0.2 /100 | #260 | Tragic 83.5% |
| Immigrants | Dominica | 0.2 /100 | #261 | Tragic 83.5% |
| Immigrants | Congo | 0.2 /100 | #262 | Tragic 83.5% |
| Iroquois | 0.2 /100 | #263 | Tragic 83.5% |
| Scotch-Irish | 0.1 /100 | #264 | Tragic 83.5% |
| Central Americans | 0.1 /100 | #265 | Tragic 83.5% |
| Spaniards | 0.1 /100 | #266 | Tragic 83.4% |
| Guamanians/Chamorros | 0.1 /100 | #267 | Tragic 83.4% |
| Hondurans | 0.1 /100 | #268 | Tragic 83.4% |
| Immigrants | Grenada | 0.1 /100 | #269 | Tragic 83.3% |
| Immigrants | Honduras | 0.0 /100 | #270 | Tragic 83.3% |
Demographics Similar to Puget Sound Salish by In Labor Force | Age 35-44
In terms of in labor force | age 35-44, the demographic groups most similar to Puget Sound Salish are Chippewa (82.9%, a difference of 0.010%), Fijian (82.9%, a difference of 0.020%), Immigrants from Bangladesh (82.9%, a difference of 0.020%), Immigrants from Belize (82.9%, a difference of 0.020%), and Immigrants from Dominican Republic (82.9%, a difference of 0.030%).
| Demographics | Rating | Rank | In Labor Force | Age 35-44 |
| Guatemalans | 0.0 /100 | #281 | Tragic 83.0% |
| Osage | 0.0 /100 | #282 | Tragic 82.9% |
| Immigrants | Guatemala | 0.0 /100 | #283 | Tragic 82.9% |
| Immigrants | Dominican Republic | 0.0 /100 | #284 | Tragic 82.9% |
| Fijians | 0.0 /100 | #285 | Tragic 82.9% |
| Immigrants | Bangladesh | 0.0 /100 | #286 | Tragic 82.9% |
| Immigrants | Belize | 0.0 /100 | #287 | Tragic 82.9% |
| Puget Sound Salish | 0.0 /100 | #288 | Tragic 82.9% |
| Chippewa | 0.0 /100 | #289 | Tragic 82.9% |
| Africans | 0.0 /100 | #290 | Tragic 82.9% |
| Pennsylvania Germans | 0.0 /100 | #291 | Tragic 82.9% |
| Immigrants | Latin America | 0.0 /100 | #292 | Tragic 82.8% |
| Spanish Americans | 0.0 /100 | #293 | Tragic 82.8% |
| Potawatomi | 0.0 /100 | #294 | Tragic 82.7% |
| Immigrants | Lebanon | 0.0 /100 | #295 | Tragic 82.7% |