Immigrants from Armenia vs Puget Sound Salish In Labor Force | Age 35-44
COMPARE
Immigrants from Armenia
Puget Sound Salish
In Labor Force | Age 35-44
In Labor Force | Age 35-44 Comparison
Immigrants from Armenia
Puget Sound Salish
83.7%
IN LABOR FORCE | AGE 35-44
0.9/ 100
METRIC RATING
247th/ 347
METRIC RANK
82.9%
IN LABOR FORCE | AGE 35-44
0.0/ 100
METRIC RATING
288th/ 347
METRIC RANK
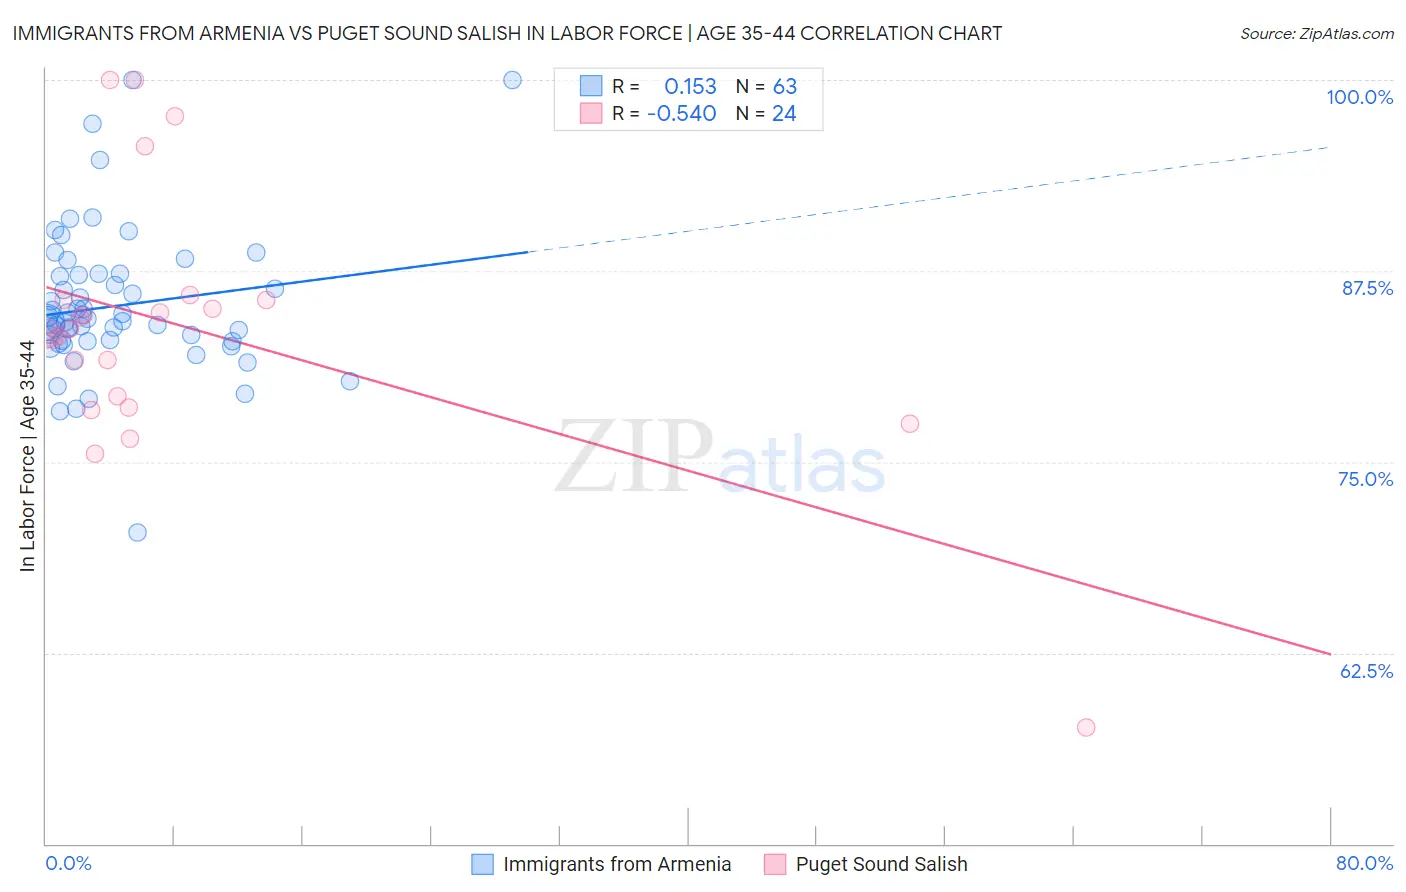
Immigrants from Armenia vs Puget Sound Salish In Labor Force | Age 35-44 Correlation Chart
The statistical analysis conducted on geographies consisting of 97,711,872 people shows a poor positive correlation between the proportion of Immigrants from Armenia and labor force participation rate among population between the ages 35 and 44 in the United States with a correlation coefficient (R) of 0.153 and weighted average of 83.7%. Similarly, the statistical analysis conducted on geographies consisting of 46,155,509 people shows a substantial negative correlation between the proportion of Puget Sound Salish and labor force participation rate among population between the ages 35 and 44 in the United States with a correlation coefficient (R) of -0.540 and weighted average of 82.9%, a difference of 0.98%.
In Labor Force | Age 35-44 Correlation Summary
| Measurement | Immigrants from Armenia | Puget Sound Salish |
| Minimum | 70.4% | 57.6% |
| Maximum | 100.0% | 100.0% |
| Range | 29.6% | 42.4% |
| Mean | 85.2% | 83.7% |
| Median | 84.2% | 83.6% |
| Interquartile 25% (IQ1) | 82.9% | 78.9% |
| Interquartile 75% (IQ3) | 87.2% | 85.6% |
| Interquartile Range (IQR) | 4.3% | 6.6% |
| Standard Deviation (Sample) | 4.8% | 8.9% |
| Standard Deviation (Population) | 4.8% | 8.7% |
Similar Demographics by In Labor Force | Age 35-44
Demographics Similar to Immigrants from Armenia by In Labor Force | Age 35-44
In terms of in labor force | age 35-44, the demographic groups most similar to Immigrants from Armenia are Immigrants (83.7%, a difference of 0.020%), Indonesian (83.7%, a difference of 0.020%), Immigrants from Western Asia (83.8%, a difference of 0.030%), Guyanese (83.8%, a difference of 0.030%), and Malaysian (83.8%, a difference of 0.030%).
| Demographics | Rating | Rank | In Labor Force | Age 35-44 |
| Arabs | 1.3 /100 | #240 | Tragic 83.8% |
| Iraqis | 1.3 /100 | #241 | Tragic 83.8% |
| Immigrants | Cambodia | 1.1 /100 | #242 | Tragic 83.8% |
| Immigrants | Western Asia | 1.1 /100 | #243 | Tragic 83.8% |
| Guyanese | 1.1 /100 | #244 | Tragic 83.8% |
| Malaysians | 1.1 /100 | #245 | Tragic 83.8% |
| Immigrants | Immigrants | 1.0 /100 | #246 | Tragic 83.7% |
| Immigrants | Armenia | 0.9 /100 | #247 | Tragic 83.7% |
| Indonesians | 0.8 /100 | #248 | Tragic 83.7% |
| Immigrants | St. Vincent and the Grenadines | 0.7 /100 | #249 | Tragic 83.7% |
| Whites/Caucasians | 0.5 /100 | #250 | Tragic 83.6% |
| Salvadorans | 0.4 /100 | #251 | Tragic 83.6% |
| Immigrants | Guyana | 0.4 /100 | #252 | Tragic 83.6% |
| Lebanese | 0.4 /100 | #253 | Tragic 83.6% |
| Tongans | 0.4 /100 | #254 | Tragic 83.6% |
Demographics Similar to Puget Sound Salish by In Labor Force | Age 35-44
In terms of in labor force | age 35-44, the demographic groups most similar to Puget Sound Salish are Chippewa (82.9%, a difference of 0.010%), Fijian (82.9%, a difference of 0.020%), Immigrants from Bangladesh (82.9%, a difference of 0.020%), Immigrants from Belize (82.9%, a difference of 0.020%), and Immigrants from Dominican Republic (82.9%, a difference of 0.030%).
| Demographics | Rating | Rank | In Labor Force | Age 35-44 |
| Guatemalans | 0.0 /100 | #281 | Tragic 83.0% |
| Osage | 0.0 /100 | #282 | Tragic 82.9% |
| Immigrants | Guatemala | 0.0 /100 | #283 | Tragic 82.9% |
| Immigrants | Dominican Republic | 0.0 /100 | #284 | Tragic 82.9% |
| Fijians | 0.0 /100 | #285 | Tragic 82.9% |
| Immigrants | Bangladesh | 0.0 /100 | #286 | Tragic 82.9% |
| Immigrants | Belize | 0.0 /100 | #287 | Tragic 82.9% |
| Puget Sound Salish | 0.0 /100 | #288 | Tragic 82.9% |
| Chippewa | 0.0 /100 | #289 | Tragic 82.9% |
| Africans | 0.0 /100 | #290 | Tragic 82.9% |
| Pennsylvania Germans | 0.0 /100 | #291 | Tragic 82.9% |
| Immigrants | Latin America | 0.0 /100 | #292 | Tragic 82.8% |
| Spanish Americans | 0.0 /100 | #293 | Tragic 82.8% |
| Potawatomi | 0.0 /100 | #294 | Tragic 82.7% |
| Immigrants | Lebanon | 0.0 /100 | #295 | Tragic 82.7% |