Black/African American vs Immigrants from Kenya In Labor Force | Age 35-44
COMPARE
Black/African American
Immigrants from Kenya
In Labor Force | Age 35-44
In Labor Force | Age 35-44 Comparison
Blacks/African Americans
Immigrants from Kenya
82.2%
IN LABOR FORCE | AGE 35-44
0.0/ 100
METRIC RATING
306th/ 347
METRIC RANK
85.1%
IN LABOR FORCE | AGE 35-44
99.6/ 100
METRIC RATING
52nd/ 347
METRIC RANK
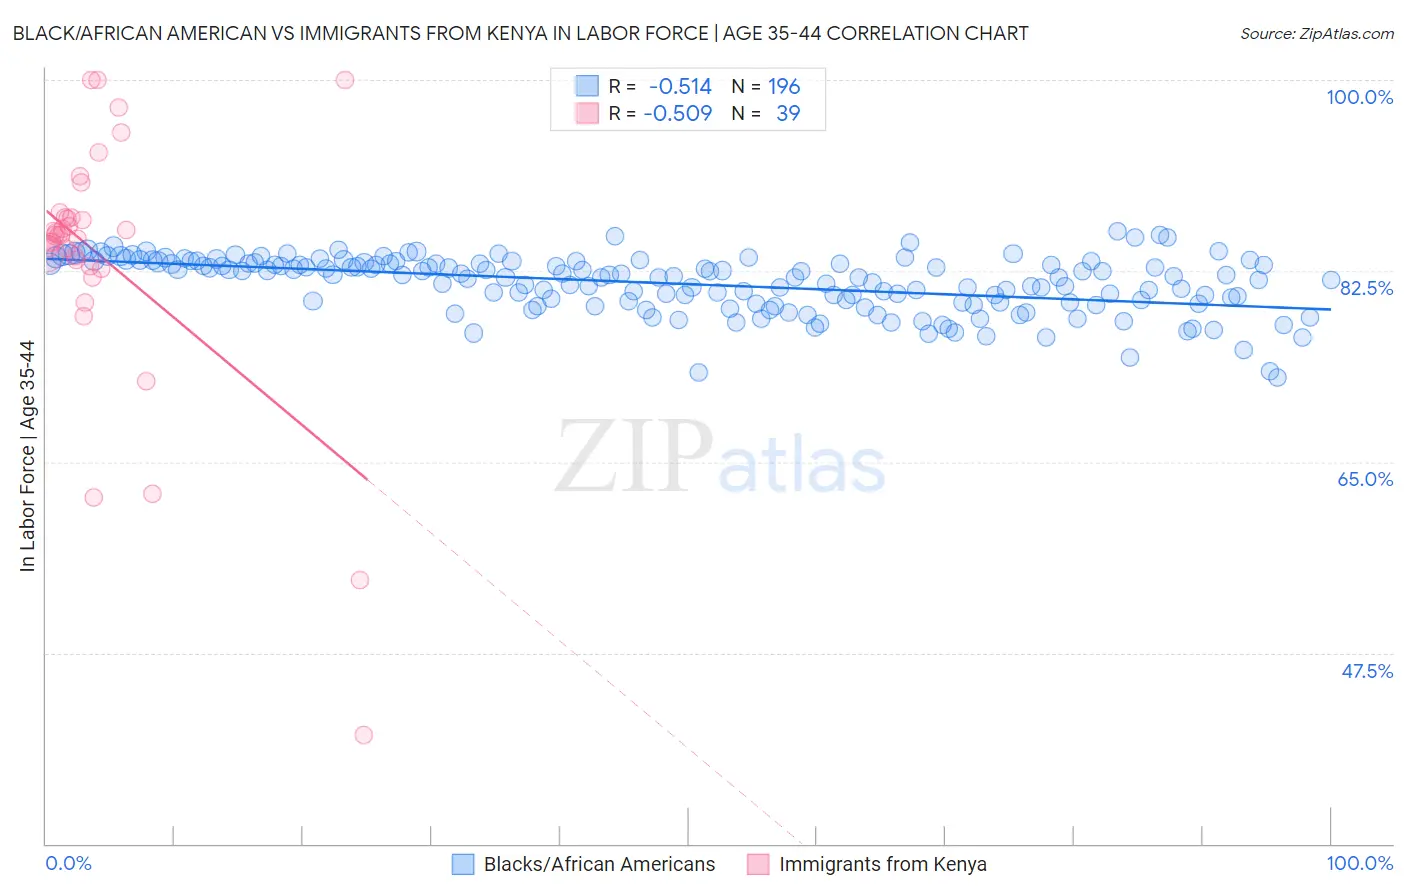
Black/African American vs Immigrants from Kenya In Labor Force | Age 35-44 Correlation Chart
The statistical analysis conducted on geographies consisting of 565,288,812 people shows a substantial negative correlation between the proportion of Blacks/African Americans and labor force participation rate among population between the ages 35 and 44 in the United States with a correlation coefficient (R) of -0.514 and weighted average of 82.2%. Similarly, the statistical analysis conducted on geographies consisting of 218,019,455 people shows a substantial negative correlation between the proportion of Immigrants from Kenya and labor force participation rate among population between the ages 35 and 44 in the United States with a correlation coefficient (R) of -0.509 and weighted average of 85.1%, a difference of 3.6%.
In Labor Force | Age 35-44 Correlation Summary
| Measurement | Black/African American | Immigrants from Kenya |
| Minimum | 72.8% | 40.0% |
| Maximum | 86.2% | 100.0% |
| Range | 13.4% | 60.0% |
| Mean | 81.3% | 83.7% |
| Median | 82.0% | 85.8% |
| Interquartile 25% (IQ1) | 79.6% | 82.9% |
| Interquartile 75% (IQ3) | 83.2% | 87.5% |
| Interquartile Range (IQR) | 3.6% | 4.6% |
| Standard Deviation (Sample) | 2.6% | 11.9% |
| Standard Deviation (Population) | 2.6% | 11.7% |
Similar Demographics by In Labor Force | Age 35-44
Demographics Similar to Blacks/African Americans by In Labor Force | Age 35-44
In terms of in labor force | age 35-44, the demographic groups most similar to Blacks/African Americans are Shoshone (82.2%, a difference of 0.020%), Hispanic or Latino (82.1%, a difference of 0.10%), Immigrants from Central America (82.0%, a difference of 0.25%), Cree (82.0%, a difference of 0.25%), and Marshallese (82.4%, a difference of 0.29%).
| Demographics | Rating | Rank | In Labor Force | Age 35-44 |
| Tlingit-Haida | 0.0 /100 | #299 | Tragic 82.5% |
| Central American Indians | 0.0 /100 | #300 | Tragic 82.5% |
| Spanish American Indians | 0.0 /100 | #301 | Tragic 82.5% |
| Americans | 0.0 /100 | #302 | Tragic 82.4% |
| Nepalese | 0.0 /100 | #303 | Tragic 82.4% |
| Marshallese | 0.0 /100 | #304 | Tragic 82.4% |
| Shoshone | 0.0 /100 | #305 | Tragic 82.2% |
| Blacks/African Americans | 0.0 /100 | #306 | Tragic 82.2% |
| Hispanics or Latinos | 0.0 /100 | #307 | Tragic 82.1% |
| Immigrants | Central America | 0.0 /100 | #308 | Tragic 82.0% |
| Cree | 0.0 /100 | #309 | Tragic 82.0% |
| Blackfeet | 0.0 /100 | #310 | Tragic 81.9% |
| Colville | 0.0 /100 | #311 | Tragic 81.7% |
| Alaska Natives | 0.0 /100 | #312 | Tragic 81.6% |
| Mexicans | 0.0 /100 | #313 | Tragic 81.6% |
Demographics Similar to Immigrants from Kenya by In Labor Force | Age 35-44
In terms of in labor force | age 35-44, the demographic groups most similar to Immigrants from Kenya are Taiwanese (85.1%, a difference of 0.010%), Immigrants from Albania (85.1%, a difference of 0.030%), Turkish (85.1%, a difference of 0.030%), Soviet Union (85.1%, a difference of 0.030%), and Thai (85.2%, a difference of 0.040%).
| Demographics | Rating | Rank | In Labor Force | Age 35-44 |
| Cypriots | 99.8 /100 | #45 | Exceptional 85.2% |
| Immigrants | Hong Kong | 99.8 /100 | #46 | Exceptional 85.2% |
| German Russians | 99.8 /100 | #47 | Exceptional 85.2% |
| Immigrants | Eritrea | 99.7 /100 | #48 | Exceptional 85.2% |
| Croatians | 99.7 /100 | #49 | Exceptional 85.2% |
| Thais | 99.7 /100 | #50 | Exceptional 85.2% |
| Immigrants | Albania | 99.7 /100 | #51 | Exceptional 85.1% |
| Immigrants | Kenya | 99.6 /100 | #52 | Exceptional 85.1% |
| Taiwanese | 99.6 /100 | #53 | Exceptional 85.1% |
| Turks | 99.5 /100 | #54 | Exceptional 85.1% |
| Soviet Union | 99.5 /100 | #55 | Exceptional 85.1% |
| Immigrants | Croatia | 99.5 /100 | #56 | Exceptional 85.1% |
| Chinese | 99.4 /100 | #57 | Exceptional 85.1% |
| Slovaks | 99.4 /100 | #58 | Exceptional 85.1% |
| Serbians | 99.4 /100 | #59 | Exceptional 85.1% |