Black/African American vs Immigrants from Western Europe In Labor Force | Age 35-44
COMPARE
Black/African American
Immigrants from Western Europe
In Labor Force | Age 35-44
In Labor Force | Age 35-44 Comparison
Blacks/African Americans
Immigrants from Western Europe
82.2%
IN LABOR FORCE | AGE 35-44
0.0/ 100
METRIC RATING
306th/ 347
METRIC RANK
84.2%
IN LABOR FORCE | AGE 35-44
24.7/ 100
METRIC RATING
197th/ 347
METRIC RANK
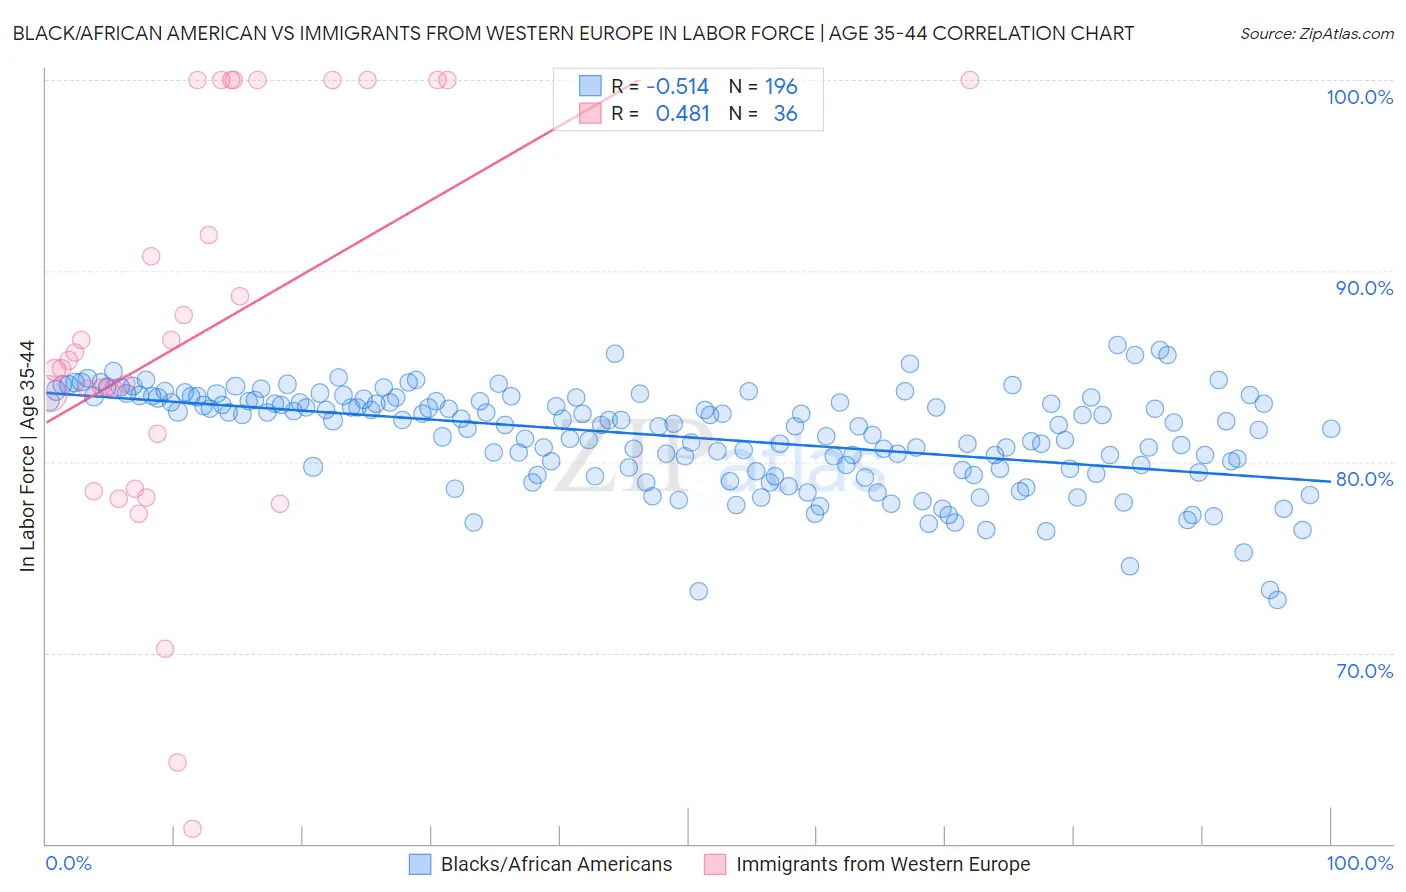
Black/African American vs Immigrants from Western Europe In Labor Force | Age 35-44 Correlation Chart
The statistical analysis conducted on geographies consisting of 565,288,812 people shows a substantial negative correlation between the proportion of Blacks/African Americans and labor force participation rate among population between the ages 35 and 44 in the United States with a correlation coefficient (R) of -0.514 and weighted average of 82.2%. Similarly, the statistical analysis conducted on geographies consisting of 493,820,556 people shows a moderate positive correlation between the proportion of Immigrants from Western Europe and labor force participation rate among population between the ages 35 and 44 in the United States with a correlation coefficient (R) of 0.481 and weighted average of 84.2%, a difference of 2.5%.
In Labor Force | Age 35-44 Correlation Summary
| Measurement | Black/African American | Immigrants from Western Europe |
| Minimum | 72.8% | 60.8% |
| Maximum | 86.2% | 100.0% |
| Range | 13.4% | 39.2% |
| Mean | 81.3% | 86.7% |
| Median | 82.0% | 85.1% |
| Interquartile 25% (IQ1) | 79.6% | 80.1% |
| Interquartile 75% (IQ3) | 83.2% | 100.0% |
| Interquartile Range (IQR) | 3.6% | 19.9% |
| Standard Deviation (Sample) | 2.6% | 10.4% |
| Standard Deviation (Population) | 2.6% | 10.3% |
Similar Demographics by In Labor Force | Age 35-44
Demographics Similar to Blacks/African Americans by In Labor Force | Age 35-44
In terms of in labor force | age 35-44, the demographic groups most similar to Blacks/African Americans are Shoshone (82.2%, a difference of 0.020%), Hispanic or Latino (82.1%, a difference of 0.10%), Immigrants from Central America (82.0%, a difference of 0.25%), Cree (82.0%, a difference of 0.25%), and Marshallese (82.4%, a difference of 0.29%).
| Demographics | Rating | Rank | In Labor Force | Age 35-44 |
| Tlingit-Haida | 0.0 /100 | #299 | Tragic 82.5% |
| Central American Indians | 0.0 /100 | #300 | Tragic 82.5% |
| Spanish American Indians | 0.0 /100 | #301 | Tragic 82.5% |
| Americans | 0.0 /100 | #302 | Tragic 82.4% |
| Nepalese | 0.0 /100 | #303 | Tragic 82.4% |
| Marshallese | 0.0 /100 | #304 | Tragic 82.4% |
| Shoshone | 0.0 /100 | #305 | Tragic 82.2% |
| Blacks/African Americans | 0.0 /100 | #306 | Tragic 82.2% |
| Hispanics or Latinos | 0.0 /100 | #307 | Tragic 82.1% |
| Immigrants | Central America | 0.0 /100 | #308 | Tragic 82.0% |
| Cree | 0.0 /100 | #309 | Tragic 82.0% |
| Blackfeet | 0.0 /100 | #310 | Tragic 81.9% |
| Colville | 0.0 /100 | #311 | Tragic 81.7% |
| Alaska Natives | 0.0 /100 | #312 | Tragic 81.6% |
| Mexicans | 0.0 /100 | #313 | Tragic 81.6% |
Demographics Similar to Immigrants from Western Europe by In Labor Force | Age 35-44
In terms of in labor force | age 35-44, the demographic groups most similar to Immigrants from Western Europe are Immigrants from England (84.2%, a difference of 0.0%), Immigrants from Indonesia (84.2%, a difference of 0.010%), Immigrants from Caribbean (84.2%, a difference of 0.010%), Ecuadorian (84.2%, a difference of 0.010%), and Syrian (84.2%, a difference of 0.010%).
| Demographics | Rating | Rank | In Labor Force | Age 35-44 |
| Portuguese | 31.9 /100 | #190 | Fair 84.3% |
| Immigrants | Philippines | 27.9 /100 | #191 | Fair 84.2% |
| Immigrants | Vietnam | 27.4 /100 | #192 | Fair 84.2% |
| Hungarians | 26.8 /100 | #193 | Fair 84.2% |
| Immigrants | Indonesia | 25.7 /100 | #194 | Fair 84.2% |
| Immigrants | Caribbean | 25.7 /100 | #195 | Fair 84.2% |
| Immigrants | England | 25.0 /100 | #196 | Fair 84.2% |
| Immigrants | Western Europe | 24.7 /100 | #197 | Fair 84.2% |
| Ecuadorians | 24.0 /100 | #198 | Fair 84.2% |
| Syrians | 23.2 /100 | #199 | Fair 84.2% |
| Moroccans | 23.2 /100 | #200 | Fair 84.2% |
| British | 23.0 /100 | #201 | Fair 84.2% |
| Immigrants | Uzbekistan | 22.8 /100 | #202 | Fair 84.2% |
| Immigrants | South Eastern Asia | 22.4 /100 | #203 | Fair 84.2% |
| Canadians | 19.9 /100 | #204 | Poor 84.2% |