Black/African American vs Cherokee In Labor Force | Age 35-44
COMPARE
Black/African American
Cherokee
In Labor Force | Age 35-44
In Labor Force | Age 35-44 Comparison
Blacks/African Americans
Cherokee
82.2%
IN LABOR FORCE | AGE 35-44
0.0/ 100
METRIC RATING
306th/ 347
METRIC RANK
81.4%
IN LABOR FORCE | AGE 35-44
0.0/ 100
METRIC RATING
317th/ 347
METRIC RANK
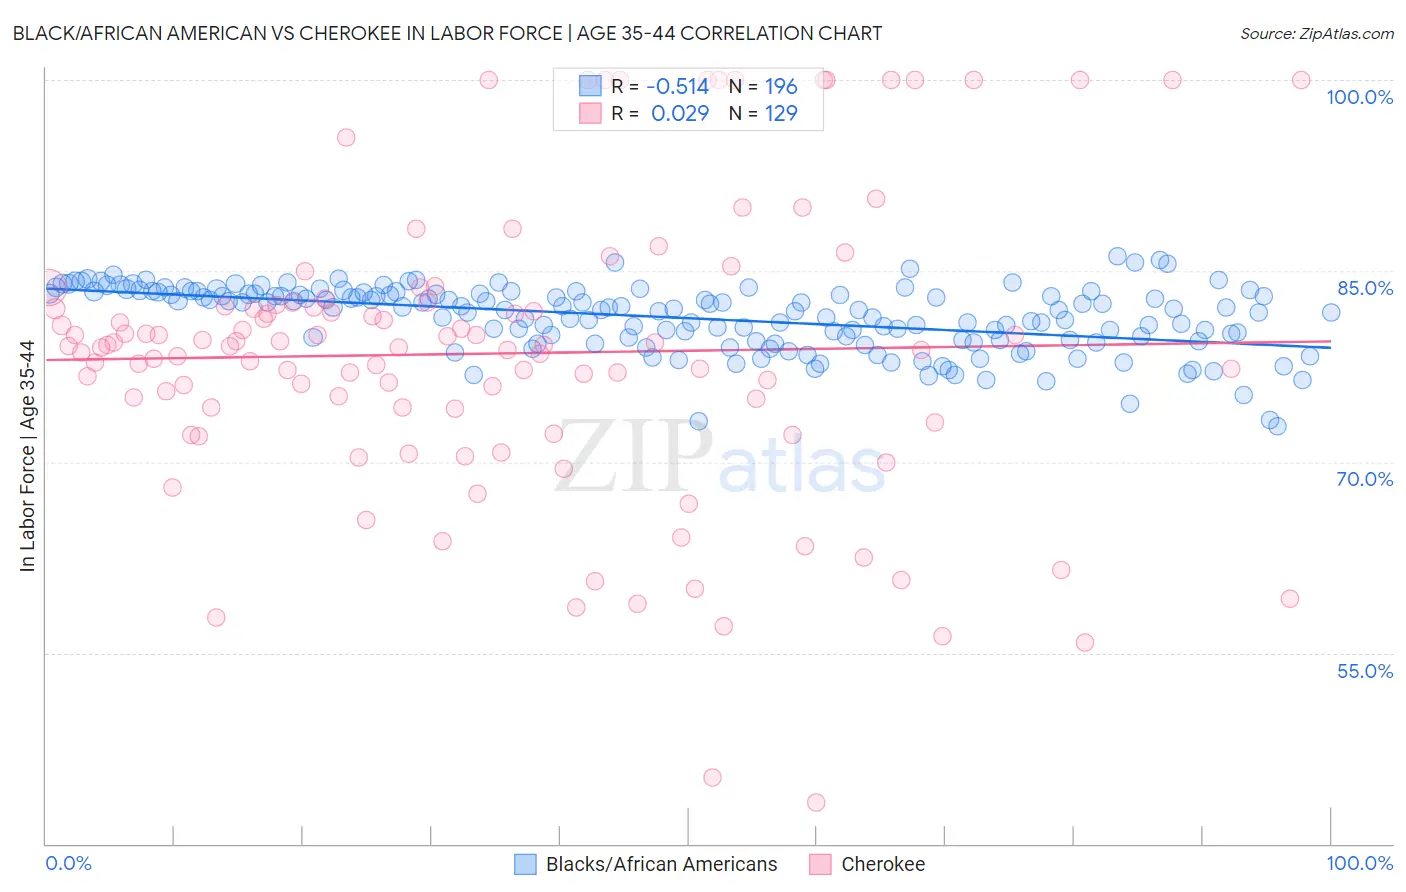
Black/African American vs Cherokee In Labor Force | Age 35-44 Correlation Chart
The statistical analysis conducted on geographies consisting of 565,288,812 people shows a substantial negative correlation between the proportion of Blacks/African Americans and labor force participation rate among population between the ages 35 and 44 in the United States with a correlation coefficient (R) of -0.514 and weighted average of 82.2%. Similarly, the statistical analysis conducted on geographies consisting of 493,377,854 people shows no correlation between the proportion of Cherokee and labor force participation rate among population between the ages 35 and 44 in the United States with a correlation coefficient (R) of 0.029 and weighted average of 81.4%, a difference of 0.94%.
In Labor Force | Age 35-44 Correlation Summary
| Measurement | Black/African American | Cherokee |
| Minimum | 72.8% | 43.2% |
| Maximum | 86.2% | 100.0% |
| Range | 13.4% | 56.8% |
| Mean | 81.3% | 78.5% |
| Median | 82.0% | 79.1% |
| Interquartile 25% (IQ1) | 79.6% | 73.6% |
| Interquartile 75% (IQ3) | 83.2% | 82.4% |
| Interquartile Range (IQR) | 3.6% | 8.8% |
| Standard Deviation (Sample) | 2.6% | 11.6% |
| Standard Deviation (Population) | 2.6% | 11.6% |
Demographics Similar to Blacks/African Americans and Cherokee by In Labor Force | Age 35-44
In terms of in labor force | age 35-44, the demographic groups most similar to Blacks/African Americans are Shoshone (82.2%, a difference of 0.020%), Hispanic or Latino (82.1%, a difference of 0.10%), Immigrants from Central America (82.0%, a difference of 0.25%), Cree (82.0%, a difference of 0.25%), and Marshallese (82.4%, a difference of 0.29%). Similarly, the demographic groups most similar to Cherokee are Comanche (81.5%, a difference of 0.080%), Immigrants from Mexico (81.5%, a difference of 0.10%), Alaskan Athabascan (81.3%, a difference of 0.12%), Cajun (81.5%, a difference of 0.13%), and Alaska Native (81.6%, a difference of 0.24%).
| Demographics | Rating | Rank | In Labor Force | Age 35-44 |
| Spanish American Indians | 0.0 /100 | #301 | Tragic 82.5% |
| Americans | 0.0 /100 | #302 | Tragic 82.4% |
| Nepalese | 0.0 /100 | #303 | Tragic 82.4% |
| Marshallese | 0.0 /100 | #304 | Tragic 82.4% |
| Shoshone | 0.0 /100 | #305 | Tragic 82.2% |
| Blacks/African Americans | 0.0 /100 | #306 | Tragic 82.2% |
| Hispanics or Latinos | 0.0 /100 | #307 | Tragic 82.1% |
| Immigrants | Central America | 0.0 /100 | #308 | Tragic 82.0% |
| Cree | 0.0 /100 | #309 | Tragic 82.0% |
| Blackfeet | 0.0 /100 | #310 | Tragic 81.9% |
| Colville | 0.0 /100 | #311 | Tragic 81.7% |
| Alaska Natives | 0.0 /100 | #312 | Tragic 81.6% |
| Mexicans | 0.0 /100 | #313 | Tragic 81.6% |
| Cajuns | 0.0 /100 | #314 | Tragic 81.5% |
| Immigrants | Mexico | 0.0 /100 | #315 | Tragic 81.5% |
| Comanche | 0.0 /100 | #316 | Tragic 81.5% |
| Cherokee | 0.0 /100 | #317 | Tragic 81.4% |
| Alaskan Athabascans | 0.0 /100 | #318 | Tragic 81.3% |
| Inupiat | 0.0 /100 | #319 | Tragic 80.9% |
| Chickasaw | 0.0 /100 | #320 | Tragic 80.9% |
| Puerto Ricans | 0.0 /100 | #321 | Tragic 80.7% |