Pueblo vs Dutch West Indian In Labor Force | Age > 16
COMPARE
Pueblo
Dutch West Indian
In Labor Force | Age > 16
In Labor Force | Age > 16 Comparison
Pueblo
Dutch West Indians
59.3%
IN LABOR FORCE | AGE > 16
0.0/ 100
METRIC RATING
340th/ 347
METRIC RANK
61.7%
IN LABOR FORCE | AGE > 16
0.0/ 100
METRIC RATING
328th/ 347
METRIC RANK
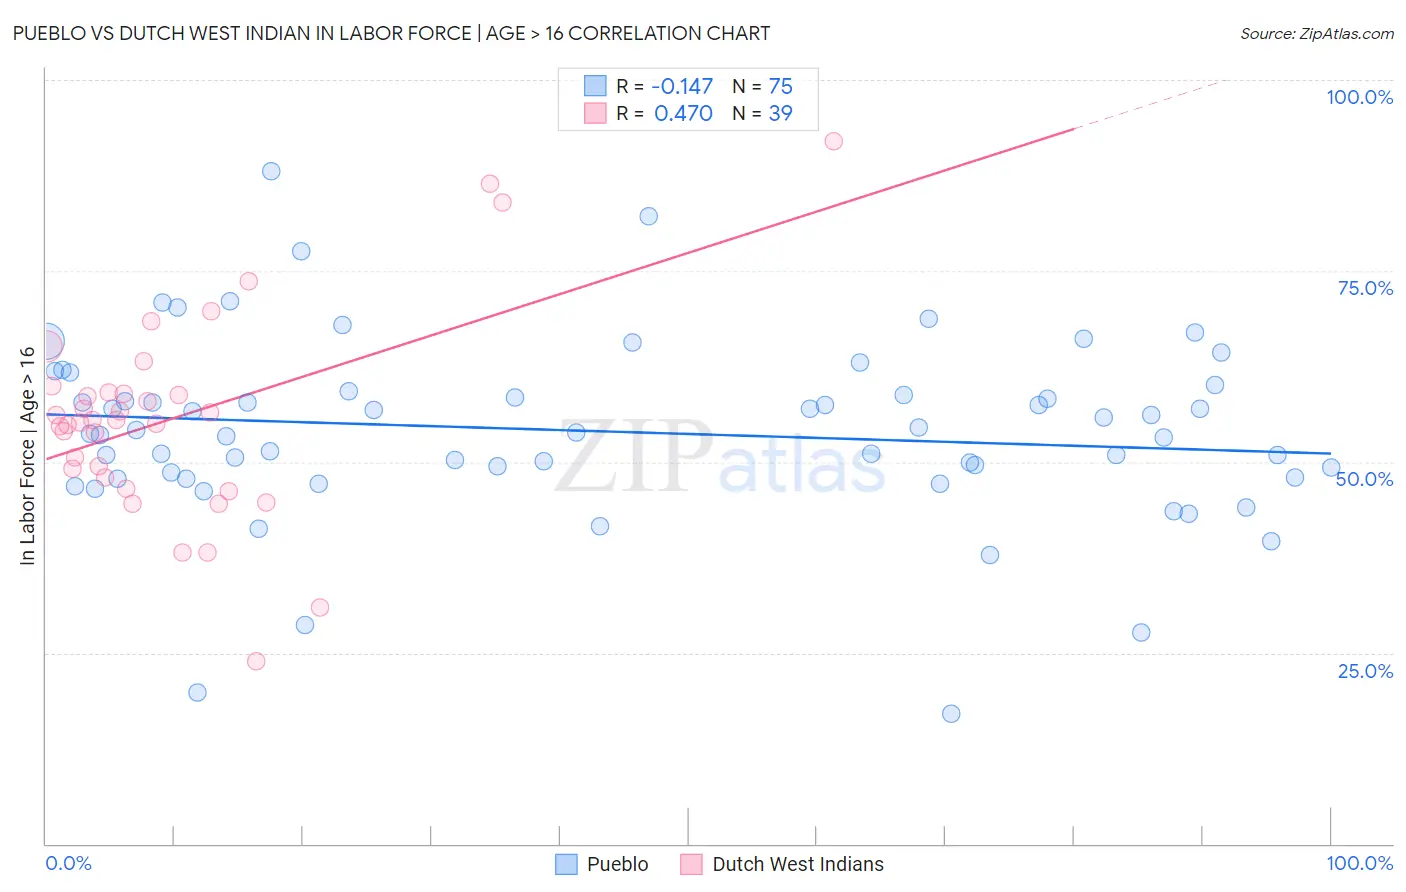
Pueblo vs Dutch West Indian In Labor Force | Age > 16 Correlation Chart
The statistical analysis conducted on geographies consisting of 120,084,171 people shows a poor negative correlation between the proportion of Pueblo and labor force participation rate among population ages 16 and over in the United States with a correlation coefficient (R) of -0.147 and weighted average of 59.3%. Similarly, the statistical analysis conducted on geographies consisting of 85,770,506 people shows a moderate positive correlation between the proportion of Dutch West Indians and labor force participation rate among population ages 16 and over in the United States with a correlation coefficient (R) of 0.470 and weighted average of 61.7%, a difference of 4.1%.
In Labor Force | Age > 16 Correlation Summary
| Measurement | Pueblo | Dutch West Indian |
| Minimum | 17.1% | 23.9% |
| Maximum | 88.1% | 91.9% |
| Range | 71.0% | 68.0% |
| Mean | 54.0% | 55.8% |
| Median | 53.9% | 55.4% |
| Interquartile 25% (IQ1) | 48.0% | 48.0% |
| Interquartile 75% (IQ3) | 59.2% | 59.0% |
| Interquartile Range (IQR) | 11.2% | 11.1% |
| Standard Deviation (Sample) | 11.9% | 13.5% |
| Standard Deviation (Population) | 11.9% | 13.3% |
Demographics Similar to Pueblo and Dutch West Indians by In Labor Force | Age > 16
In terms of in labor force | age > 16, the demographic groups most similar to Pueblo are Houma (59.5%, a difference of 0.39%), Immigrants from Yemen (59.6%, a difference of 0.64%), Colville (59.8%, a difference of 0.92%), Hopi (58.4%, a difference of 1.5%), and Puerto Rican (58.1%, a difference of 2.0%). Similarly, the demographic groups most similar to Dutch West Indians are Cajun (61.8%, a difference of 0.16%), Sioux (61.8%, a difference of 0.27%), Choctaw (61.5%, a difference of 0.36%), Cherokee (61.9%, a difference of 0.45%), and Cheyenne (62.0%, a difference of 0.49%).
| Demographics | Rating | Rank | In Labor Force | Age > 16 |
| Cheyenne | 0.0 /100 | #324 | Tragic 62.0% |
| Cherokee | 0.0 /100 | #325 | Tragic 61.9% |
| Sioux | 0.0 /100 | #326 | Tragic 61.8% |
| Cajuns | 0.0 /100 | #327 | Tragic 61.8% |
| Dutch West Indians | 0.0 /100 | #328 | Tragic 61.7% |
| Choctaw | 0.0 /100 | #329 | Tragic 61.5% |
| Creek | 0.0 /100 | #330 | Tragic 61.3% |
| Ute | 0.0 /100 | #331 | Tragic 60.9% |
| Crow | 0.0 /100 | #332 | Tragic 60.8% |
| Paiute | 0.0 /100 | #333 | Tragic 60.7% |
| Apache | 0.0 /100 | #334 | Tragic 60.7% |
| Natives/Alaskans | 0.0 /100 | #335 | Tragic 60.6% |
| Menominee | 0.0 /100 | #336 | Tragic 60.6% |
| Colville | 0.0 /100 | #337 | Tragic 59.8% |
| Immigrants | Yemen | 0.0 /100 | #338 | Tragic 59.6% |
| Houma | 0.0 /100 | #339 | Tragic 59.5% |
| Pueblo | 0.0 /100 | #340 | Tragic 59.3% |
| Hopi | 0.0 /100 | #341 | Tragic 58.4% |
| Puerto Ricans | 0.0 /100 | #342 | Tragic 58.1% |
| Yuman | 0.0 /100 | #343 | Tragic 57.8% |
| Pima | 0.0 /100 | #344 | Tragic 57.4% |