Immigrants from Central America vs Dutch West Indian In Labor Force | Age > 16
COMPARE
Immigrants from Central America
Dutch West Indian
In Labor Force | Age > 16
In Labor Force | Age > 16 Comparison
Immigrants from Central America
Dutch West Indians
64.7%
IN LABOR FORCE | AGE > 16
10.5/ 100
METRIC RATING
219th/ 347
METRIC RANK
61.7%
IN LABOR FORCE | AGE > 16
0.0/ 100
METRIC RATING
328th/ 347
METRIC RANK
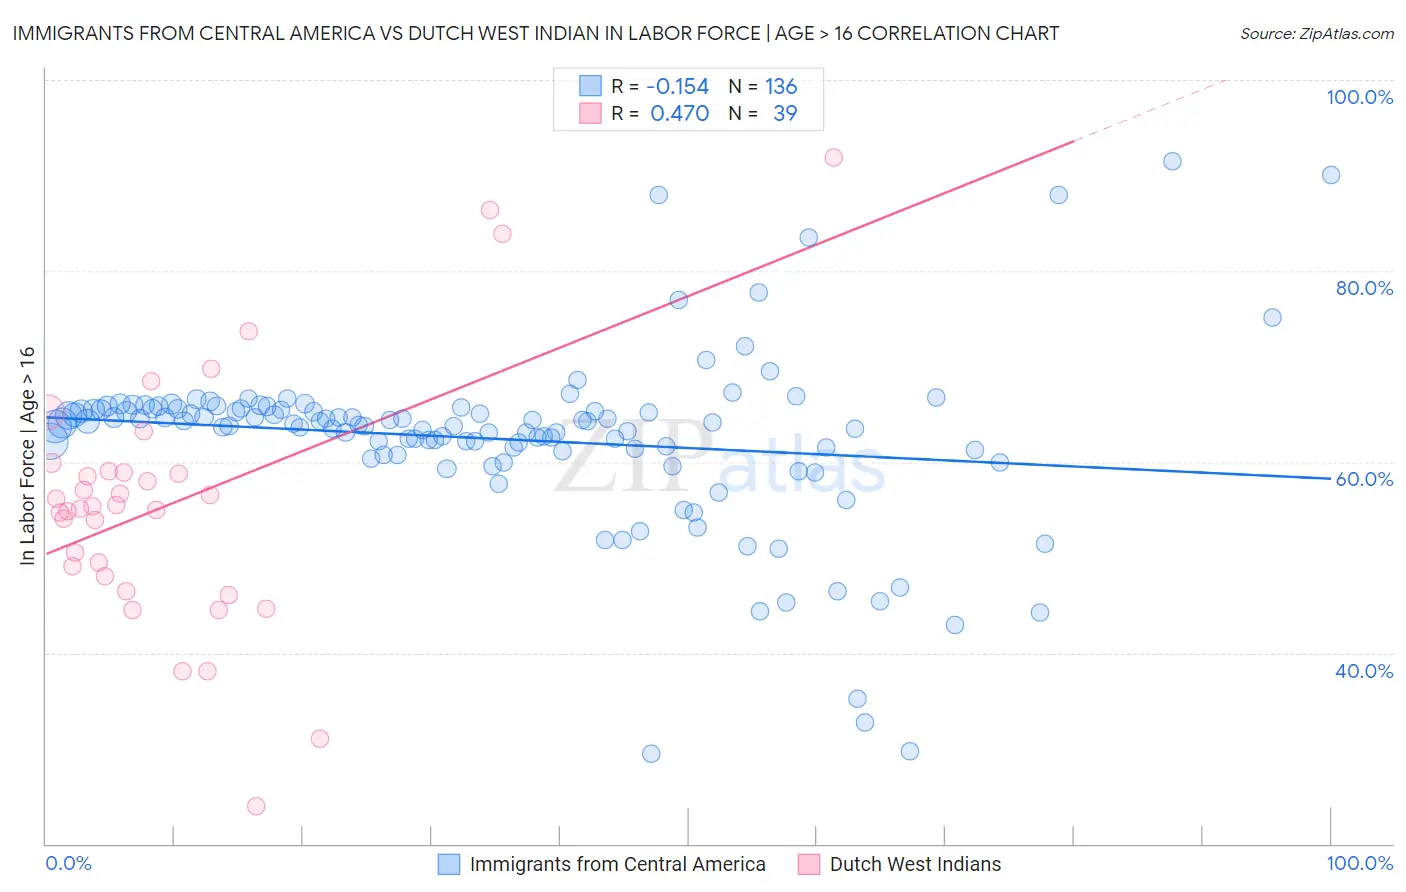
Immigrants from Central America vs Dutch West Indian In Labor Force | Age > 16 Correlation Chart
The statistical analysis conducted on geographies consisting of 536,509,301 people shows a poor negative correlation between the proportion of Immigrants from Central America and labor force participation rate among population ages 16 and over in the United States with a correlation coefficient (R) of -0.154 and weighted average of 64.7%. Similarly, the statistical analysis conducted on geographies consisting of 85,770,506 people shows a moderate positive correlation between the proportion of Dutch West Indians and labor force participation rate among population ages 16 and over in the United States with a correlation coefficient (R) of 0.470 and weighted average of 61.7%, a difference of 5.0%.
In Labor Force | Age > 16 Correlation Summary
| Measurement | Immigrants from Central America | Dutch West Indian |
| Minimum | 29.4% | 23.9% |
| Maximum | 91.5% | 91.9% |
| Range | 62.1% | 68.0% |
| Mean | 62.4% | 55.8% |
| Median | 64.0% | 55.4% |
| Interquartile 25% (IQ1) | 61.2% | 48.0% |
| Interquartile 75% (IQ3) | 65.5% | 59.0% |
| Interquartile Range (IQR) | 4.3% | 11.1% |
| Standard Deviation (Sample) | 9.3% | 13.5% |
| Standard Deviation (Population) | 9.3% | 13.3% |
Similar Demographics by In Labor Force | Age > 16
Demographics Similar to Immigrants from Central America by In Labor Force | Age > 16
In terms of in labor force | age > 16, the demographic groups most similar to Immigrants from Central America are Alsatian (64.7%, a difference of 0.010%), Belgian (64.7%, a difference of 0.020%), U.S. Virgin Islander (64.7%, a difference of 0.020%), Alaska Native (64.7%, a difference of 0.020%), and Immigrants from Micronesia (64.7%, a difference of 0.030%).
| Demographics | Rating | Rank | In Labor Force | Age > 16 |
| Alaskan Athabascans | 13.9 /100 | #212 | Poor 64.8% |
| Maltese | 13.8 /100 | #213 | Poor 64.8% |
| Estonians | 13.1 /100 | #214 | Poor 64.8% |
| Immigrants | Czechoslovakia | 12.3 /100 | #215 | Poor 64.8% |
| Belgians | 11.4 /100 | #216 | Poor 64.7% |
| U.S. Virgin Islanders | 11.3 /100 | #217 | Poor 64.7% |
| Alsatians | 10.7 /100 | #218 | Poor 64.7% |
| Immigrants | Central America | 10.5 /100 | #219 | Poor 64.7% |
| Alaska Natives | 9.9 /100 | #220 | Tragic 64.7% |
| Immigrants | Micronesia | 9.6 /100 | #221 | Tragic 64.7% |
| Hawaiians | 9.3 /100 | #222 | Tragic 64.7% |
| Immigrants | Belize | 9.2 /100 | #223 | Tragic 64.7% |
| Immigrants | Jamaica | 8.8 /100 | #224 | Tragic 64.7% |
| Croatians | 8.8 /100 | #225 | Tragic 64.7% |
| Europeans | 8.3 /100 | #226 | Tragic 64.7% |
Demographics Similar to Dutch West Indians by In Labor Force | Age > 16
In terms of in labor force | age > 16, the demographic groups most similar to Dutch West Indians are Cajun (61.8%, a difference of 0.16%), Sioux (61.8%, a difference of 0.27%), Choctaw (61.5%, a difference of 0.36%), Cherokee (61.9%, a difference of 0.45%), and Cheyenne (62.0%, a difference of 0.49%).
| Demographics | Rating | Rank | In Labor Force | Age > 16 |
| Americans | 0.0 /100 | #321 | Tragic 62.1% |
| Ottawa | 0.0 /100 | #322 | Tragic 62.0% |
| Seminole | 0.0 /100 | #323 | Tragic 62.0% |
| Cheyenne | 0.0 /100 | #324 | Tragic 62.0% |
| Cherokee | 0.0 /100 | #325 | Tragic 61.9% |
| Sioux | 0.0 /100 | #326 | Tragic 61.8% |
| Cajuns | 0.0 /100 | #327 | Tragic 61.8% |
| Dutch West Indians | 0.0 /100 | #328 | Tragic 61.7% |
| Choctaw | 0.0 /100 | #329 | Tragic 61.5% |
| Creek | 0.0 /100 | #330 | Tragic 61.3% |
| Ute | 0.0 /100 | #331 | Tragic 60.9% |
| Crow | 0.0 /100 | #332 | Tragic 60.8% |
| Paiute | 0.0 /100 | #333 | Tragic 60.7% |
| Apache | 0.0 /100 | #334 | Tragic 60.7% |
| Natives/Alaskans | 0.0 /100 | #335 | Tragic 60.6% |