Aleut vs Dutch West Indian Unemployment Among Ages 30 to 34 years
COMPARE
Aleut
Dutch West Indian
Unemployment Among Ages 30 to 34 years
Unemployment Among Ages 30 to 34 years Comparison
Aleuts
Dutch West Indians
7.1%
UNEMPLOYMENT AMONG AGES 30 TO 34 YEARS
0.0/ 100
METRIC RATING
315th/ 347
METRIC RANK
6.6%
UNEMPLOYMENT AMONG AGES 30 TO 34 YEARS
0.0/ 100
METRIC RATING
299th/ 347
METRIC RANK
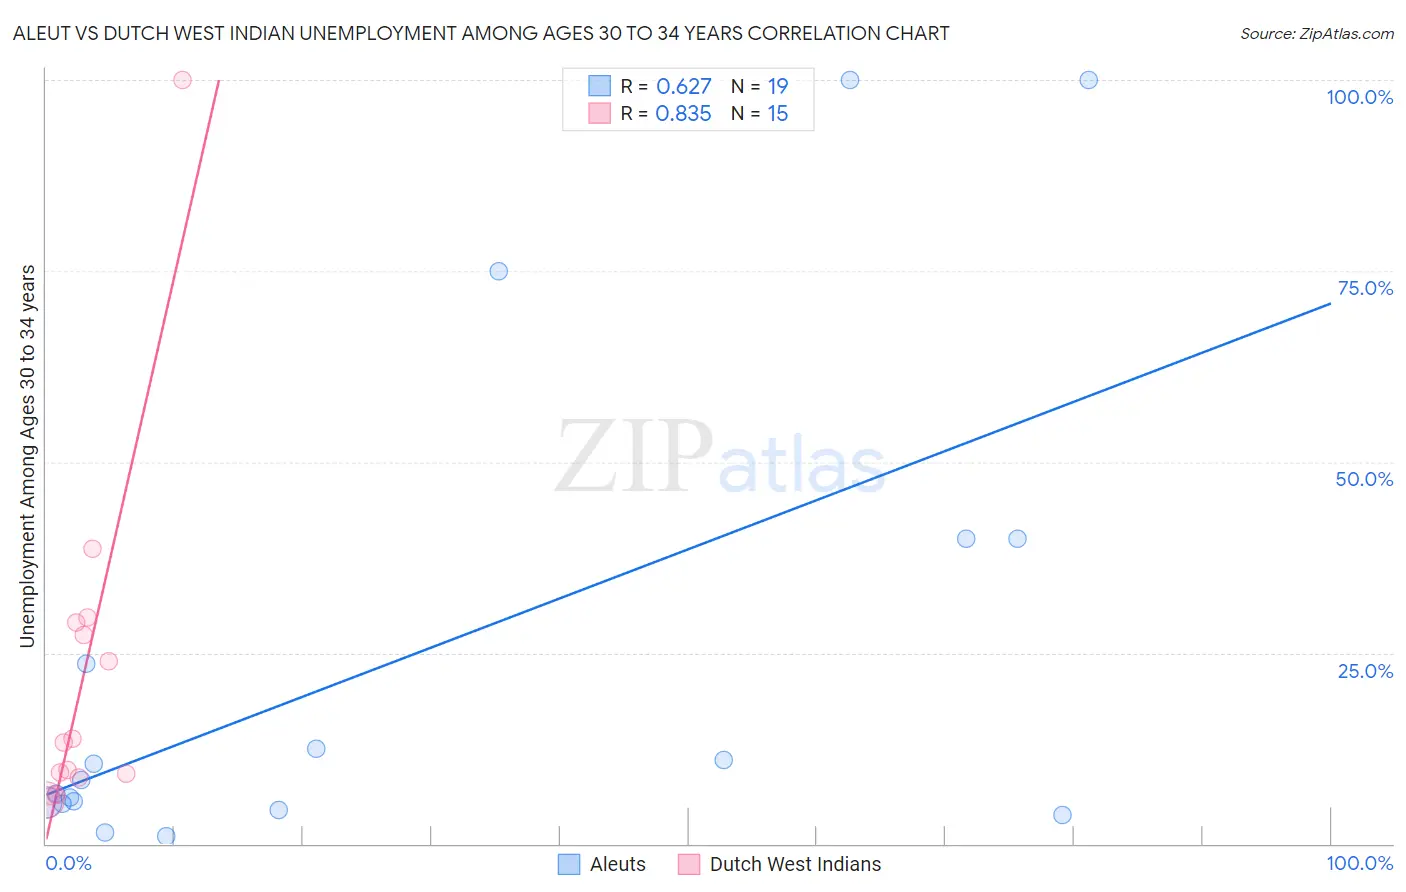
Aleut vs Dutch West Indian Unemployment Among Ages 30 to 34 years Correlation Chart
The statistical analysis conducted on geographies consisting of 60,709,035 people shows a significant positive correlation between the proportion of Aleuts and unemployment rate among population between the ages 30 and 34 in the United States with a correlation coefficient (R) of 0.627 and weighted average of 7.1%. Similarly, the statistical analysis conducted on geographies consisting of 82,832,966 people shows a very strong positive correlation between the proportion of Dutch West Indians and unemployment rate among population between the ages 30 and 34 in the United States with a correlation coefficient (R) of 0.835 and weighted average of 6.6%, a difference of 7.7%.
Unemployment Among Ages 30 to 34 years Correlation Summary
| Measurement | Aleut | Dutch West Indian |
| Minimum | 1.0% | 5.7% |
| Maximum | 100.0% | 100.0% |
| Range | 99.0% | 94.3% |
| Mean | 24.2% | 22.0% |
| Median | 8.3% | 13.2% |
| Interquartile 25% (IQ1) | 5.3% | 8.7% |
| Interquartile 75% (IQ3) | 40.0% | 28.9% |
| Interquartile Range (IQR) | 34.7% | 20.3% |
| Standard Deviation (Sample) | 32.4% | 24.0% |
| Standard Deviation (Population) | 31.5% | 23.2% |
Demographics Similar to Aleuts and Dutch West Indians by Unemployment Among Ages 30 to 34 years
In terms of unemployment among ages 30 to 34 years, the demographic groups most similar to Aleuts are Lumbee (7.1%, a difference of 0.37%), Ute (7.0%, a difference of 0.58%), British West Indian (7.0%, a difference of 0.62%), Alaskan Athabascan (7.0%, a difference of 0.69%), and Houma (7.2%, a difference of 1.0%). Similarly, the demographic groups most similar to Dutch West Indians are Bahamian (6.6%, a difference of 0.050%), Immigrants from Barbados (6.6%, a difference of 0.10%), Belizean (6.6%, a difference of 0.34%), Creek (6.6%, a difference of 0.35%), and Delaware (6.7%, a difference of 1.2%).
| Demographics | Rating | Rank | Unemployment Among Ages 30 to 34 years |
| Creek | 0.0 /100 | #297 | Tragic 6.6% |
| Immigrants | Barbados | 0.0 /100 | #298 | Tragic 6.6% |
| Dutch West Indians | 0.0 /100 | #299 | Tragic 6.6% |
| Bahamians | 0.0 /100 | #300 | Tragic 6.6% |
| Belizeans | 0.0 /100 | #301 | Tragic 6.6% |
| Delaware | 0.0 /100 | #302 | Tragic 6.7% |
| Cajuns | 0.0 /100 | #303 | Tragic 6.7% |
| Kiowa | 0.0 /100 | #304 | Tragic 6.7% |
| Paiute | 0.0 /100 | #305 | Tragic 6.7% |
| Immigrants | Armenia | 0.0 /100 | #306 | Tragic 6.8% |
| Immigrants | Belize | 0.0 /100 | #307 | Tragic 6.9% |
| Immigrants | Azores | 0.0 /100 | #308 | Tragic 6.9% |
| Immigrants | Grenada | 0.0 /100 | #309 | Tragic 6.9% |
| Immigrants | St. Vincent and the Grenadines | 0.0 /100 | #310 | Tragic 7.0% |
| Alaskan Athabascans | 0.0 /100 | #311 | Tragic 7.0% |
| British West Indians | 0.0 /100 | #312 | Tragic 7.0% |
| Ute | 0.0 /100 | #313 | Tragic 7.0% |
| Lumbee | 0.0 /100 | #314 | Tragic 7.1% |
| Aleuts | 0.0 /100 | #315 | Tragic 7.1% |
| Houma | 0.0 /100 | #316 | Tragic 7.2% |
| Immigrants | Cabo Verde | 0.0 /100 | #317 | Tragic 7.2% |