Uruguayan vs Dutch West Indian In Labor Force | Age > 16
COMPARE
Uruguayan
Dutch West Indian
In Labor Force | Age > 16
In Labor Force | Age > 16 Comparison
Uruguayans
Dutch West Indians
65.9%
IN LABOR FORCE | AGE > 16
98.6/ 100
METRIC RATING
102nd/ 347
METRIC RANK
61.7%
IN LABOR FORCE | AGE > 16
0.0/ 100
METRIC RATING
328th/ 347
METRIC RANK
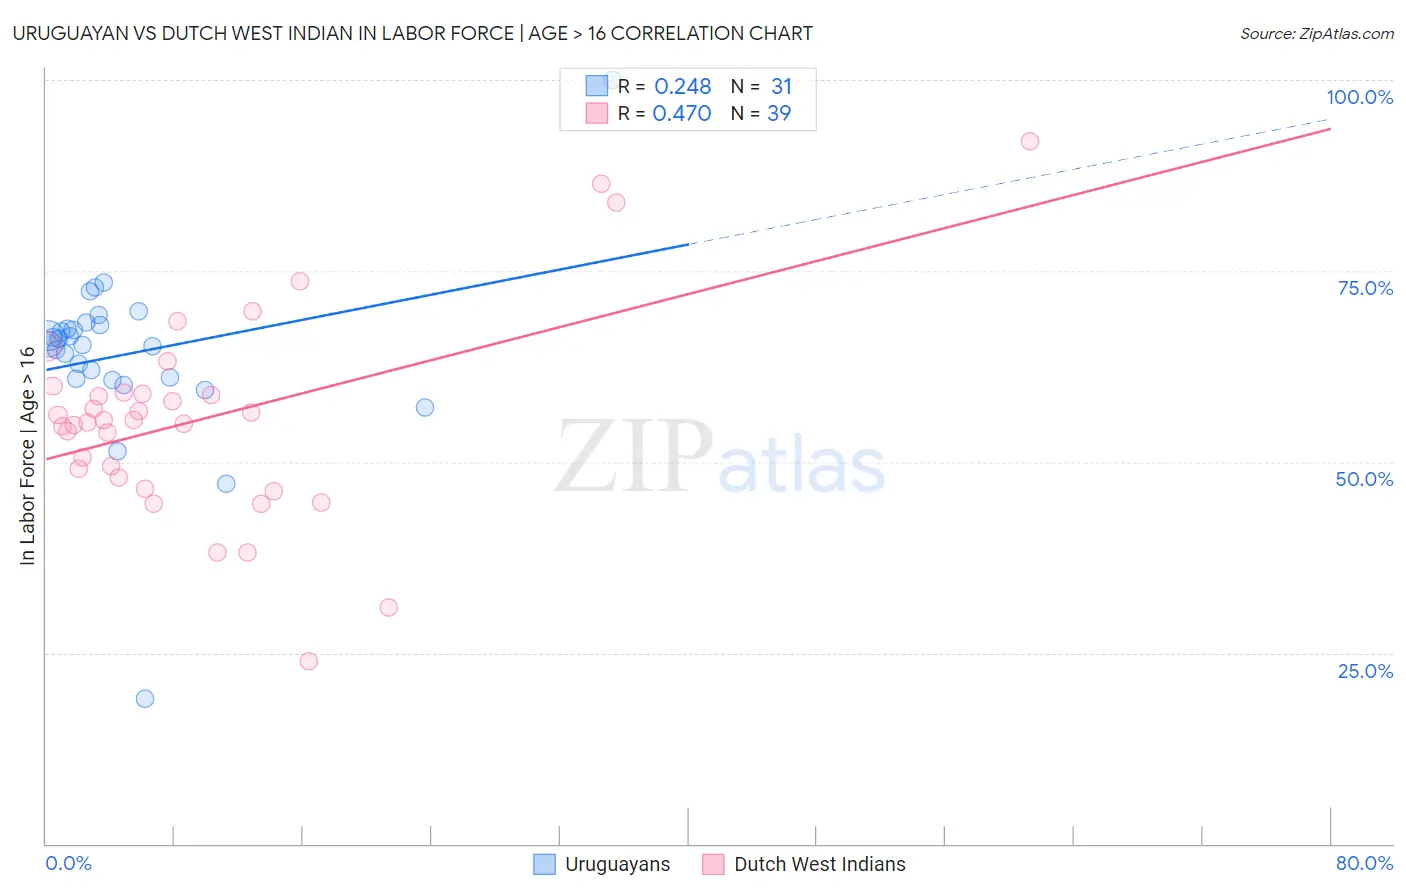
Uruguayan vs Dutch West Indian In Labor Force | Age > 16 Correlation Chart
The statistical analysis conducted on geographies consisting of 144,784,894 people shows a weak positive correlation between the proportion of Uruguayans and labor force participation rate among population ages 16 and over in the United States with a correlation coefficient (R) of 0.248 and weighted average of 65.9%. Similarly, the statistical analysis conducted on geographies consisting of 85,770,506 people shows a moderate positive correlation between the proportion of Dutch West Indians and labor force participation rate among population ages 16 and over in the United States with a correlation coefficient (R) of 0.470 and weighted average of 61.7%, a difference of 6.9%.
In Labor Force | Age > 16 Correlation Summary
| Measurement | Uruguayan | Dutch West Indian |
| Minimum | 19.0% | 23.9% |
| Maximum | 100.0% | 91.9% |
| Range | 81.0% | 68.0% |
| Mean | 64.1% | 55.8% |
| Median | 65.8% | 55.4% |
| Interquartile 25% (IQ1) | 60.9% | 48.0% |
| Interquartile 75% (IQ3) | 68.0% | 59.0% |
| Interquartile Range (IQR) | 7.1% | 11.1% |
| Standard Deviation (Sample) | 11.9% | 13.5% |
| Standard Deviation (Population) | 11.7% | 13.3% |
Similar Demographics by In Labor Force | Age > 16
Demographics Similar to Uruguayans by In Labor Force | Age > 16
In terms of in labor force | age > 16, the demographic groups most similar to Uruguayans are Immigrants from Colombia (65.9%, a difference of 0.0%), Immigrants from Australia (65.9%, a difference of 0.010%), Okinawan (65.9%, a difference of 0.010%), Immigrants from Chile (65.9%, a difference of 0.020%), and Immigrants from South Eastern Asia (65.9%, a difference of 0.020%).
| Demographics | Rating | Rank | In Labor Force | Age > 16 |
| Immigrants | Uruguay | 99.1 /100 | #95 | Exceptional 66.0% |
| Bangladeshis | 98.9 /100 | #96 | Exceptional 65.9% |
| Filipinos | 98.9 /100 | #97 | Exceptional 65.9% |
| Immigrants | Chile | 98.7 /100 | #98 | Exceptional 65.9% |
| Immigrants | Australia | 98.7 /100 | #99 | Exceptional 65.9% |
| Okinawans | 98.7 /100 | #100 | Exceptional 65.9% |
| Immigrants | Colombia | 98.6 /100 | #101 | Exceptional 65.9% |
| Uruguayans | 98.6 /100 | #102 | Exceptional 65.9% |
| Immigrants | South Eastern Asia | 98.5 /100 | #103 | Exceptional 65.9% |
| Palestinians | 98.5 /100 | #104 | Exceptional 65.9% |
| Colombians | 98.4 /100 | #105 | Exceptional 65.9% |
| Immigrants | Serbia | 98.1 /100 | #106 | Exceptional 65.8% |
| Immigrants | Poland | 98.1 /100 | #107 | Exceptional 65.8% |
| Immigrants | Spain | 98.0 /100 | #108 | Exceptional 65.8% |
| Immigrants | Japan | 98.0 /100 | #109 | Exceptional 65.8% |
Demographics Similar to Dutch West Indians by In Labor Force | Age > 16
In terms of in labor force | age > 16, the demographic groups most similar to Dutch West Indians are Cajun (61.8%, a difference of 0.16%), Sioux (61.8%, a difference of 0.27%), Choctaw (61.5%, a difference of 0.36%), Cherokee (61.9%, a difference of 0.45%), and Cheyenne (62.0%, a difference of 0.49%).
| Demographics | Rating | Rank | In Labor Force | Age > 16 |
| Americans | 0.0 /100 | #321 | Tragic 62.1% |
| Ottawa | 0.0 /100 | #322 | Tragic 62.0% |
| Seminole | 0.0 /100 | #323 | Tragic 62.0% |
| Cheyenne | 0.0 /100 | #324 | Tragic 62.0% |
| Cherokee | 0.0 /100 | #325 | Tragic 61.9% |
| Sioux | 0.0 /100 | #326 | Tragic 61.8% |
| Cajuns | 0.0 /100 | #327 | Tragic 61.8% |
| Dutch West Indians | 0.0 /100 | #328 | Tragic 61.7% |
| Choctaw | 0.0 /100 | #329 | Tragic 61.5% |
| Creek | 0.0 /100 | #330 | Tragic 61.3% |
| Ute | 0.0 /100 | #331 | Tragic 60.9% |
| Crow | 0.0 /100 | #332 | Tragic 60.8% |
| Paiute | 0.0 /100 | #333 | Tragic 60.7% |
| Apache | 0.0 /100 | #334 | Tragic 60.7% |
| Natives/Alaskans | 0.0 /100 | #335 | Tragic 60.6% |