Japanese vs Dutch West Indian In Labor Force | Age > 16
COMPARE
Japanese
Dutch West Indian
In Labor Force | Age > 16
In Labor Force | Age > 16 Comparison
Japanese
Dutch West Indians
65.8%
IN LABOR FORCE | AGE > 16
97.7/ 100
METRIC RATING
110th/ 347
METRIC RANK
61.7%
IN LABOR FORCE | AGE > 16
0.0/ 100
METRIC RATING
328th/ 347
METRIC RANK
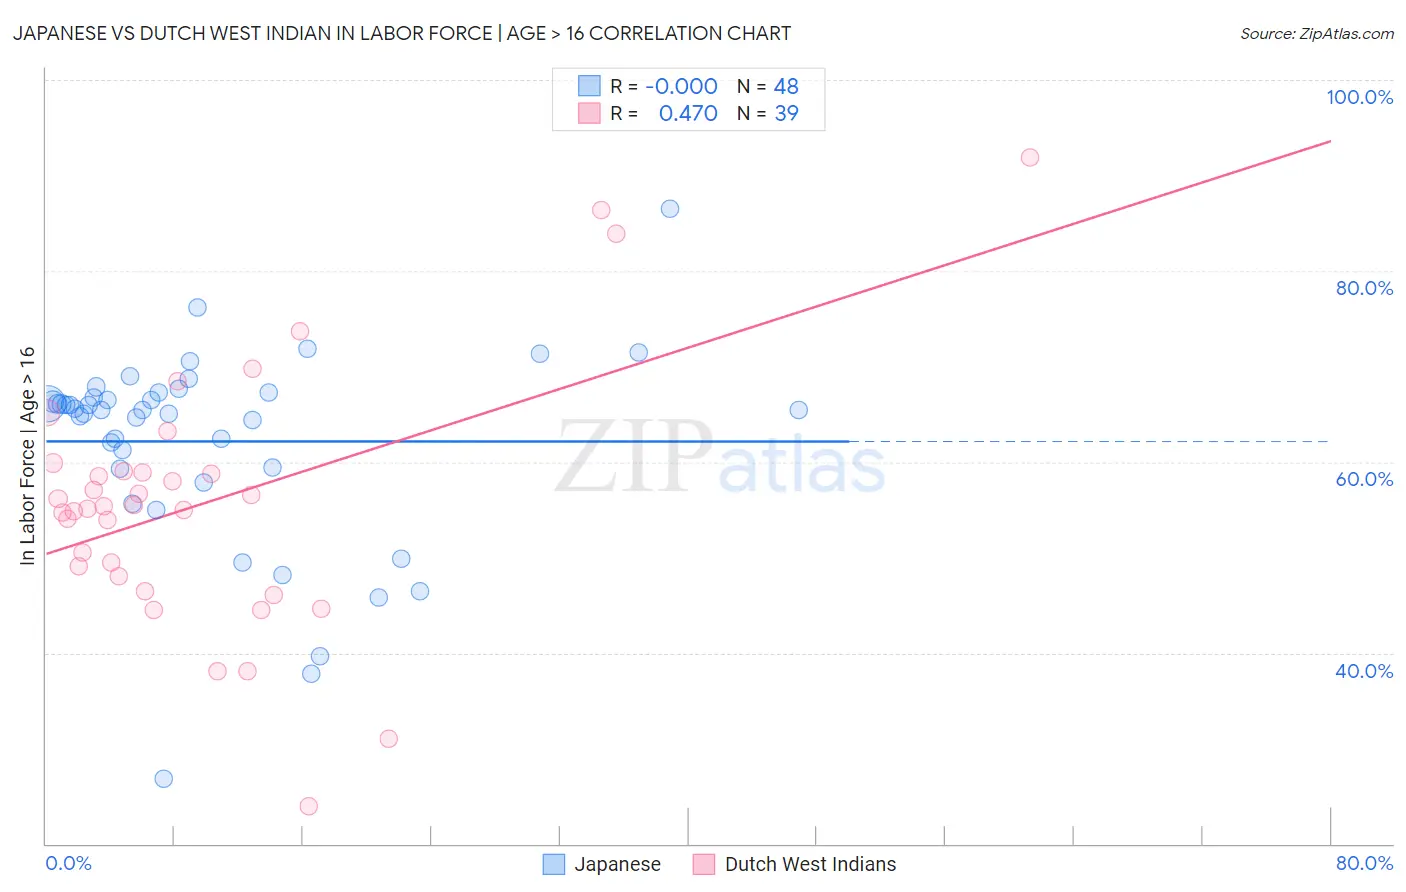
Japanese vs Dutch West Indian In Labor Force | Age > 16 Correlation Chart
The statistical analysis conducted on geographies consisting of 249,190,051 people shows no correlation between the proportion of Japanese and labor force participation rate among population ages 16 and over in the United States with a correlation coefficient (R) of -0.000 and weighted average of 65.8%. Similarly, the statistical analysis conducted on geographies consisting of 85,770,506 people shows a moderate positive correlation between the proportion of Dutch West Indians and labor force participation rate among population ages 16 and over in the United States with a correlation coefficient (R) of 0.470 and weighted average of 61.7%, a difference of 6.7%.
In Labor Force | Age > 16 Correlation Summary
| Measurement | Japanese | Dutch West Indian |
| Minimum | 26.8% | 23.9% |
| Maximum | 86.5% | 91.9% |
| Range | 59.7% | 68.0% |
| Mean | 62.1% | 55.8% |
| Median | 65.4% | 55.4% |
| Interquartile 25% (IQ1) | 59.4% | 48.0% |
| Interquartile 75% (IQ3) | 67.0% | 59.0% |
| Interquartile Range (IQR) | 7.6% | 11.1% |
| Standard Deviation (Sample) | 10.4% | 13.5% |
| Standard Deviation (Population) | 10.3% | 13.3% |
Similar Demographics by In Labor Force | Age > 16
Demographics Similar to Japanese by In Labor Force | Age > 16
In terms of in labor force | age > 16, the demographic groups most similar to Japanese are Immigrants from Honduras (65.8%, a difference of 0.020%), Immigrants from Spain (65.8%, a difference of 0.040%), Immigrants from Japan (65.8%, a difference of 0.040%), Laotian (65.8%, a difference of 0.040%), and Immigrants from Poland (65.8%, a difference of 0.050%).
| Demographics | Rating | Rank | In Labor Force | Age > 16 |
| Immigrants | South Eastern Asia | 98.5 /100 | #103 | Exceptional 65.9% |
| Palestinians | 98.5 /100 | #104 | Exceptional 65.9% |
| Colombians | 98.4 /100 | #105 | Exceptional 65.9% |
| Immigrants | Serbia | 98.1 /100 | #106 | Exceptional 65.8% |
| Immigrants | Poland | 98.1 /100 | #107 | Exceptional 65.8% |
| Immigrants | Spain | 98.0 /100 | #108 | Exceptional 65.8% |
| Immigrants | Japan | 98.0 /100 | #109 | Exceptional 65.8% |
| Japanese | 97.7 /100 | #110 | Exceptional 65.8% |
| Immigrants | Honduras | 97.5 /100 | #111 | Exceptional 65.8% |
| Laotians | 97.4 /100 | #112 | Exceptional 65.8% |
| Pakistanis | 97.1 /100 | #113 | Exceptional 65.8% |
| Hondurans | 97.1 /100 | #114 | Exceptional 65.8% |
| Immigrants | Indonesia | 96.8 /100 | #115 | Exceptional 65.7% |
| Argentineans | 96.7 /100 | #116 | Exceptional 65.7% |
| Immigrants | Iran | 96.6 /100 | #117 | Exceptional 65.7% |
Demographics Similar to Dutch West Indians by In Labor Force | Age > 16
In terms of in labor force | age > 16, the demographic groups most similar to Dutch West Indians are Cajun (61.8%, a difference of 0.16%), Sioux (61.8%, a difference of 0.27%), Choctaw (61.5%, a difference of 0.36%), Cherokee (61.9%, a difference of 0.45%), and Cheyenne (62.0%, a difference of 0.49%).
| Demographics | Rating | Rank | In Labor Force | Age > 16 |
| Americans | 0.0 /100 | #321 | Tragic 62.1% |
| Ottawa | 0.0 /100 | #322 | Tragic 62.0% |
| Seminole | 0.0 /100 | #323 | Tragic 62.0% |
| Cheyenne | 0.0 /100 | #324 | Tragic 62.0% |
| Cherokee | 0.0 /100 | #325 | Tragic 61.9% |
| Sioux | 0.0 /100 | #326 | Tragic 61.8% |
| Cajuns | 0.0 /100 | #327 | Tragic 61.8% |
| Dutch West Indians | 0.0 /100 | #328 | Tragic 61.7% |
| Choctaw | 0.0 /100 | #329 | Tragic 61.5% |
| Creek | 0.0 /100 | #330 | Tragic 61.3% |
| Ute | 0.0 /100 | #331 | Tragic 60.9% |
| Crow | 0.0 /100 | #332 | Tragic 60.8% |
| Paiute | 0.0 /100 | #333 | Tragic 60.7% |
| Apache | 0.0 /100 | #334 | Tragic 60.7% |
| Natives/Alaskans | 0.0 /100 | #335 | Tragic 60.6% |