Aleut vs Dutch West Indian Single Mother Households
COMPARE
Aleut
Dutch West Indian
Single Mother Households
Single Mother Households Comparison
Aleuts
Dutch West Indians
6.8%
SINGLE MOTHER HOUSEHOLDS
4.8/ 100
METRIC RATING
217th/ 347
METRIC RANK
7.3%
SINGLE MOTHER HOUSEHOLDS
0.4/ 100
METRIC RATING
247th/ 347
METRIC RANK
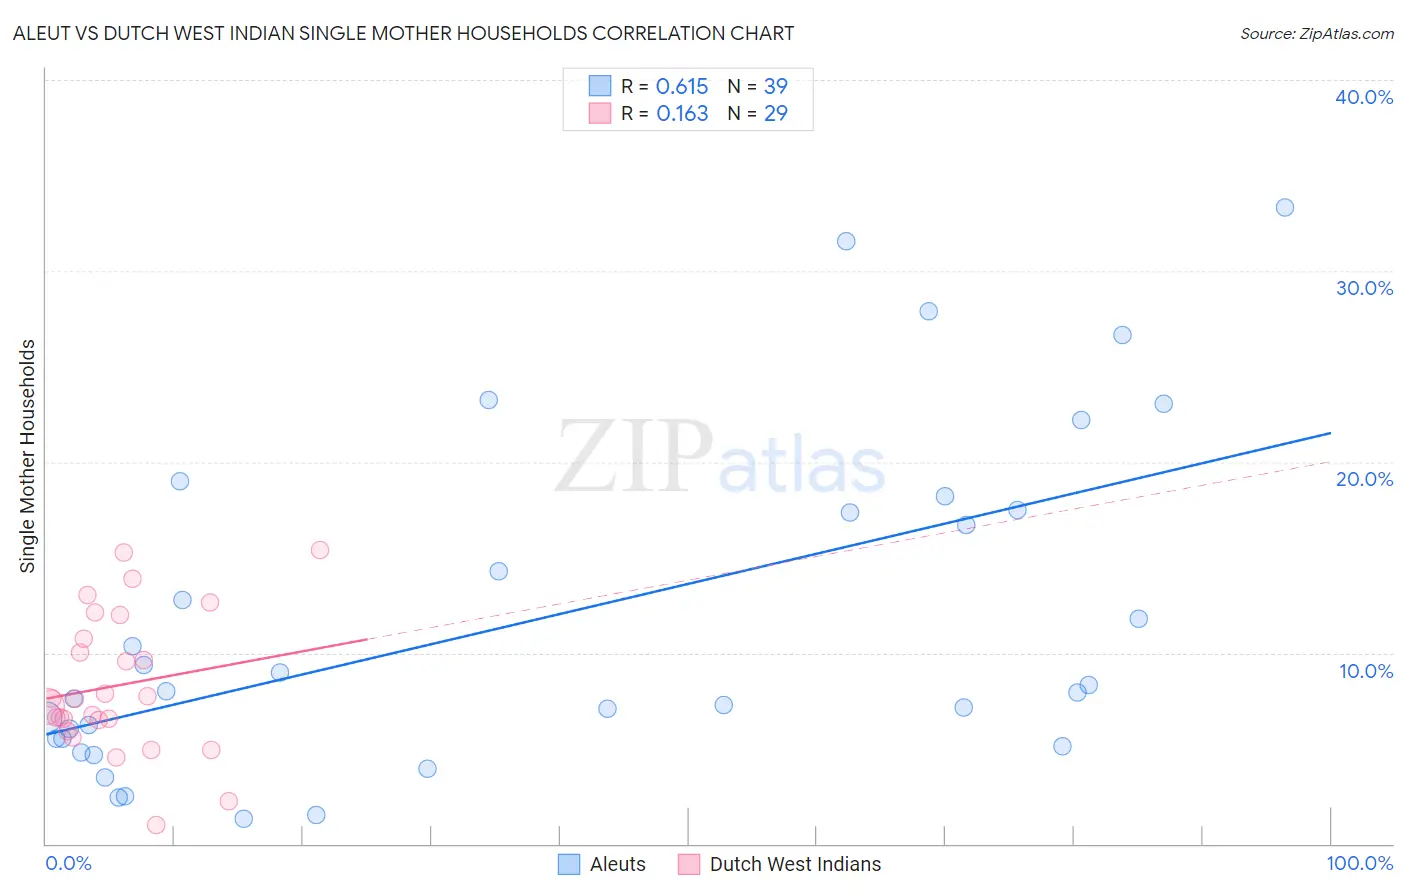
Aleut vs Dutch West Indian Single Mother Households Correlation Chart
The statistical analysis conducted on geographies consisting of 61,699,549 people shows a significant positive correlation between the proportion of Aleuts and percentage of single mother households in the United States with a correlation coefficient (R) of 0.615 and weighted average of 6.8%. Similarly, the statistical analysis conducted on geographies consisting of 85,708,147 people shows a poor positive correlation between the proportion of Dutch West Indians and percentage of single mother households in the United States with a correlation coefficient (R) of 0.163 and weighted average of 7.3%, a difference of 6.3%.
Single Mother Households Correlation Summary
| Measurement | Aleut | Dutch West Indian |
| Minimum | 1.3% | 0.97% |
| Maximum | 33.3% | 15.4% |
| Range | 32.0% | 14.4% |
| Mean | 11.7% | 8.3% |
| Median | 8.0% | 7.6% |
| Interquartile 25% (IQ1) | 5.5% | 6.2% |
| Interquartile 75% (IQ3) | 17.5% | 11.3% |
| Interquartile Range (IQR) | 12.0% | 5.2% |
| Standard Deviation (Sample) | 8.7% | 3.6% |
| Standard Deviation (Population) | 8.6% | 3.6% |
Similar Demographics by Single Mother Households
Demographics Similar to Aleuts by Single Mother Households
In terms of single mother households, the demographic groups most similar to Aleuts are Cherokee (6.8%, a difference of 0.14%), Immigrants from Eastern Africa (6.8%, a difference of 0.21%), Immigrants (6.8%, a difference of 0.30%), Shoshone (6.8%, a difference of 0.44%), and Immigrants from Thailand (6.9%, a difference of 0.49%).
| Demographics | Rating | Rank | Single Mother Households |
| Immigrants | Nonimmigrants | 10.4 /100 | #210 | Poor 6.7% |
| Immigrants | Venezuela | 8.5 /100 | #211 | Tragic 6.7% |
| Immigrants | Eritrea | 8.4 /100 | #212 | Tragic 6.7% |
| Immigrants | Costa Rica | 8.2 /100 | #213 | Tragic 6.7% |
| Immigrants | Uruguay | 7.9 /100 | #214 | Tragic 6.7% |
| Shoshone | 5.7 /100 | #215 | Tragic 6.8% |
| Cherokee | 5.1 /100 | #216 | Tragic 6.8% |
| Aleuts | 4.8 /100 | #217 | Tragic 6.8% |
| Immigrants | Eastern Africa | 4.4 /100 | #218 | Tragic 6.8% |
| Immigrants | Immigrants | 4.3 /100 | #219 | Tragic 6.8% |
| Immigrants | Thailand | 4.0 /100 | #220 | Tragic 6.9% |
| French American Indians | 3.7 /100 | #221 | Tragic 6.9% |
| Immigrants | Bangladesh | 3.7 /100 | #222 | Tragic 6.9% |
| Immigrants | Micronesia | 3.6 /100 | #223 | Tragic 6.9% |
| Immigrants | Sudan | 3.5 /100 | #224 | Tragic 6.9% |
Demographics Similar to Dutch West Indians by Single Mother Households
In terms of single mother households, the demographic groups most similar to Dutch West Indians are Spanish American Indian (7.3%, a difference of 0.030%), Nicaraguan (7.2%, a difference of 0.25%), Bermudan (7.3%, a difference of 0.32%), Immigrants from Africa (7.3%, a difference of 0.33%), and Immigrants from Cambodia (7.2%, a difference of 0.43%).
| Demographics | Rating | Rank | Single Mother Households |
| Immigrants | Panama | 0.7 /100 | #240 | Tragic 7.2% |
| Immigrants | Portugal | 0.6 /100 | #241 | Tragic 7.2% |
| Fijians | 0.6 /100 | #242 | Tragic 7.2% |
| Ecuadorians | 0.6 /100 | #243 | Tragic 7.2% |
| Cubans | 0.6 /100 | #244 | Tragic 7.2% |
| Immigrants | Cambodia | 0.5 /100 | #245 | Tragic 7.2% |
| Nicaraguans | 0.5 /100 | #246 | Tragic 7.2% |
| Dutch West Indians | 0.4 /100 | #247 | Tragic 7.3% |
| Spanish American Indians | 0.4 /100 | #248 | Tragic 7.3% |
| Bermudans | 0.4 /100 | #249 | Tragic 7.3% |
| Immigrants | Africa | 0.4 /100 | #250 | Tragic 7.3% |
| Malaysians | 0.3 /100 | #251 | Tragic 7.3% |
| Alaskan Athabascans | 0.3 /100 | #252 | Tragic 7.3% |
| Cajuns | 0.3 /100 | #253 | Tragic 7.3% |
| Immigrants | Ecuador | 0.3 /100 | #254 | Tragic 7.3% |