Albanian vs Belizean In Labor Force | Age > 16
COMPARE
Albanian
Belizean
In Labor Force | Age > 16
In Labor Force | Age > 16 Comparison
Albanians
Belizeans
65.3%
IN LABOR FORCE | AGE > 16
70.8/ 100
METRIC RATING
162nd/ 347
METRIC RANK
64.8%
IN LABOR FORCE | AGE > 16
16.2/ 100
METRIC RATING
208th/ 347
METRIC RANK
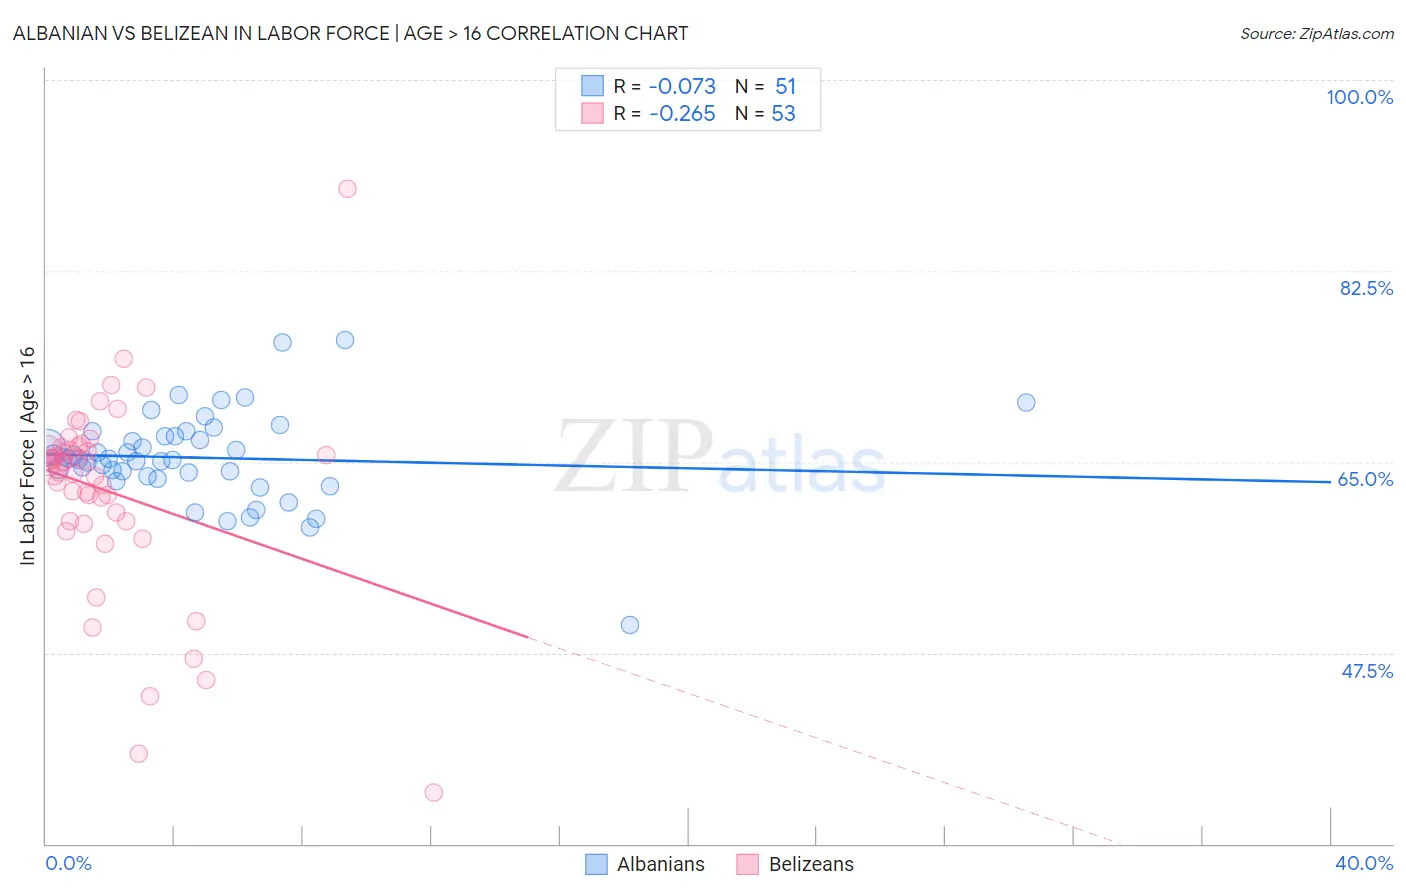
Albanian vs Belizean In Labor Force | Age > 16 Correlation Chart
The statistical analysis conducted on geographies consisting of 193,265,279 people shows a slight negative correlation between the proportion of Albanians and labor force participation rate among population ages 16 and over in the United States with a correlation coefficient (R) of -0.073 and weighted average of 65.3%. Similarly, the statistical analysis conducted on geographies consisting of 144,214,233 people shows a weak negative correlation between the proportion of Belizeans and labor force participation rate among population ages 16 and over in the United States with a correlation coefficient (R) of -0.265 and weighted average of 64.8%, a difference of 0.71%.
In Labor Force | Age > 16 Correlation Summary
| Measurement | Albanian | Belizean |
| Minimum | 50.1% | 34.7% |
| Maximum | 76.2% | 90.0% |
| Range | 26.1% | 55.3% |
| Mean | 65.4% | 62.3% |
| Median | 65.3% | 64.7% |
| Interquartile 25% (IQ1) | 63.7% | 59.6% |
| Interquartile 75% (IQ3) | 67.4% | 66.2% |
| Interquartile Range (IQR) | 3.7% | 6.6% |
| Standard Deviation (Sample) | 4.2% | 9.1% |
| Standard Deviation (Population) | 4.2% | 9.0% |
Similar Demographics by In Labor Force | Age > 16
Demographics Similar to Albanians by In Labor Force | Age > 16
In terms of in labor force | age > 16, the demographic groups most similar to Albanians are Australian (65.3%, a difference of 0.010%), South African (65.3%, a difference of 0.010%), Danish (65.3%, a difference of 0.030%), Immigrants from South Africa (65.3%, a difference of 0.040%), and Immigrants from Kazakhstan (65.3%, a difference of 0.040%).
| Demographics | Rating | Rank | In Labor Force | Age > 16 |
| Immigrants | Armenia | 76.6 /100 | #155 | Good 65.3% |
| Immigrants | Ireland | 75.9 /100 | #156 | Good 65.3% |
| Immigrants | Russia | 75.7 /100 | #157 | Good 65.3% |
| Panamanians | 75.2 /100 | #158 | Good 65.3% |
| Immigrants | Syria | 74.6 /100 | #159 | Good 65.3% |
| Immigrants | South Africa | 73.5 /100 | #160 | Good 65.3% |
| Australians | 71.3 /100 | #161 | Good 65.3% |
| Albanians | 70.8 /100 | #162 | Good 65.3% |
| South Africans | 69.8 /100 | #163 | Good 65.3% |
| Danes | 68.8 /100 | #164 | Good 65.3% |
| Immigrants | Kazakhstan | 68.1 /100 | #165 | Good 65.3% |
| Immigrants | Western Asia | 67.3 /100 | #166 | Good 65.3% |
| Immigrants | Belarus | 66.0 /100 | #167 | Good 65.2% |
| Serbians | 63.5 /100 | #168 | Good 65.2% |
| Arabs | 62.4 /100 | #169 | Good 65.2% |
Demographics Similar to Belizeans by In Labor Force | Age > 16
In terms of in labor force | age > 16, the demographic groups most similar to Belizeans are Immigrants from Latin America (64.8%, a difference of 0.010%), Immigrants from Trinidad and Tobago (64.8%, a difference of 0.010%), Lithuanian (64.8%, a difference of 0.020%), Immigrants from Denmark (64.8%, a difference of 0.030%), and Fijian (64.8%, a difference of 0.040%).
| Demographics | Rating | Rank | In Labor Force | Age > 16 |
| Ukrainians | 19.6 /100 | #201 | Poor 64.9% |
| Immigrants | Belgium | 19.4 /100 | #202 | Poor 64.9% |
| Russians | 18.8 /100 | #203 | Poor 64.9% |
| Slovenes | 18.7 /100 | #204 | Poor 64.9% |
| Jamaicans | 18.7 /100 | #205 | Poor 64.9% |
| Lithuanians | 17.4 /100 | #206 | Poor 64.8% |
| Immigrants | Latin America | 16.4 /100 | #207 | Poor 64.8% |
| Belizeans | 16.2 /100 | #208 | Poor 64.8% |
| Immigrants | Trinidad and Tobago | 15.6 /100 | #209 | Poor 64.8% |
| Immigrants | Denmark | 14.7 /100 | #210 | Poor 64.8% |
| Fijians | 14.1 /100 | #211 | Poor 64.8% |
| Alaskan Athabascans | 13.9 /100 | #212 | Poor 64.8% |
| Maltese | 13.8 /100 | #213 | Poor 64.8% |
| Estonians | 13.1 /100 | #214 | Poor 64.8% |
| Immigrants | Czechoslovakia | 12.3 /100 | #215 | Poor 64.8% |