Albanian vs Immigrants from Northern Africa In Labor Force | Age > 16

COMPARE

Albanian
Race
Ancestry
AfghanAfricanAlaska NativeAlaskan AthabascanAlbanianAleutAlsatianAmericanApacheArabArapahoArgentineanArmenianAssyrian/Chaldean/SyriacAustralianAustrianBahamianBangladeshiBarbadianBasqueBelgianBelizeanBermudanBhutaneseBlackfeetBolivianBrazilianBritishBritish West IndianBulgarianBurmeseCajunCambodianCanadianCape VerdeanCarpatho RusynCelticCentral AmericanCentral American IndianCherokeeCheyenneChickasawChileanChineseChippewaChoctawColombianColvilleComancheCosta RicanCreeCreekCroatianCrowCubanCypriotCzechCzechoslovakianDanishDelawareDominicanDutchDutch West IndianEastern EuropeanEcuadorianEgyptianEnglishEstonianEthiopianEuropeanFijianFilipinoFinnishFrenchFrench American IndianFrench CanadianGermanGerman RussianGhanaianGreekGuamanian/ChamorroGuatemalanGuyaneseHaitianHmongHonduranHopiHoumaHungarianIcelanderIndian (Asian)IndonesianInupiatIranianIraqiIrishIroquoisIsraeliItalianJamaicanJapaneseJordanianKenyanKiowaKoreanLaotianLatvianLebaneseLiberianLithuanianLumbeeLuxembourgerMacedonianMalaysianMalteseMarshalleseMenomineeMexicanMexican American IndianMongolianMoroccanNative HawaiianNavajoNepaleseNew ZealanderNicaraguanNigerianNorthern EuropeanNorwegianOkinawanOsageOttawaPaiutePakistaniPalestinianPanamanianParaguayanPennsylvania GermanPeruvianPimaPolishPortuguesePotawatomiPuebloPuerto RicanPuget Sound SalishRomanianRussianSalvadoranSamoanScandinavianScotch-IrishScottishSeminoleSenegaleseSerbianShoshoneSierra LeoneanSiouxSlavicSlovakSloveneSomaliSouth AfricanSouth AmericanSouth American IndianSoviet UnionSpaniardSpanishSpanish AmericanSpanish American IndianSri LankanSubsaharan AfricanSudaneseSwedishSwissSyrianTaiwaneseThaiTlingit-HaidaTohono O'OdhamTonganTrinidadian and TobagonianTsimshianTurkishU.S. Virgin IslanderUgandanUkrainianUruguayanUteVenezuelanVietnameseWelshWest IndianYakamaYaquiYugoslavianYumanYup'ikZimbabwean
Immigration
NonimmigrantsImmigrantsAfghanistanAfricaAlbaniaArgentinaArmeniaAsiaAustraliaAustriaBahamasBangladeshBarbadosBelarusBelgiumBelizeBoliviaBosnia and HerzegovinaBrazilBulgariaBurma/MyanmarCabo VerdeCambodiaCameroonCanadaCaribbeanCentral AmericaChileChinaColombiaCongoCosta RicaCroatiaCubaCzechoslovakiaDenmarkDominicaDominican RepublicEastern AfricaEastern AsiaEastern EuropeEcuadorEgyptEl SalvadorEnglandEritreaEthiopiaEuropeFijiFranceGermanyGhanaGreeceGrenadaGuatemalaGuyanaHaitiHondurasHong KongHungaryIndiaIndonesiaIranIraqIrelandIsraelItalyJamaicaJapanJordanKazakhstanKenyaKoreaKuwaitLaosLatin AmericaLatviaLebanonLiberiaLithuaniaMalaysiaMexicoMicronesiaMiddle AfricaMoldovaMoroccoNepalNetherlandsNicaraguaNigeriaNorth AmericaNorth MacedoniaNorthern EuropeNorwayOceaniaPakistanPanamaPeruPhilippinesPolandPortugalRomaniaRussiaSaudi ArabiaScotlandSenegalSerbiaSierra LeoneSingaporeSomaliaSouth AfricaSouth AmericaSouth Central AsiaSouth Eastern AsiaSouthern EuropeSpainSri LankaSt. Vincent and the GrenadinesSudanSwedenSwitzerlandSyriaTaiwanThailandTrinidad and TobagoTurkeyUgandaUkraineUruguayUzbekistanVenezuelaVietnamWest IndiesWestern AfricaWestern AsiaWestern EuropeYemenZaireZimbabweAzores
Immigrants from Northern Africa
Race
Ancestry
AfghanAfricanAlaska NativeAlaskan AthabascanAleutAlsatianAmericanApacheArabArapahoArgentineanArmenianAssyrian/Chaldean/SyriacAustralianAustrianBahamianBangladeshiBarbadianBasqueBelgianBelizeanBermudanBhutaneseBlackfeetBolivianBrazilianBritishBritish West IndianBulgarianBurmeseCajunCambodianCanadianCape VerdeanCarpatho RusynCelticCentral AmericanCentral American IndianCherokeeCheyenneChickasawChileanChineseChippewaChoctawColombianColvilleComancheCosta RicanCreeCreekCroatianCrowCubanCypriotCzechCzechoslovakianDanishDelawareDominicanDutchDutch West IndianEastern EuropeanEcuadorianEgyptianEnglishEstonianEthiopianEuropeanFijianFilipinoFinnishFrenchFrench American IndianFrench CanadianGermanGerman RussianGhanaianGreekGuamanian/ChamorroGuatemalanGuyaneseHaitianHmongHonduranHopiHoumaHungarianIcelanderIndian (Asian)IndonesianInupiatIranianIraqiIrishIroquoisIsraeliItalianJamaicanJapaneseJordanianKenyanKiowaKoreanLaotianLatvianLebaneseLiberianLithuanianLumbeeLuxembourgerMacedonianMalaysianMalteseMarshalleseMenomineeMexicanMexican American IndianMongolianMoroccanNative HawaiianNavajoNepaleseNew ZealanderNicaraguanNigerianNorthern EuropeanNorwegianOkinawanOsageOttawaPaiutePakistaniPalestinianPanamanianParaguayanPennsylvania GermanPeruvianPimaPolishPortuguesePotawatomiPuebloPuerto RicanPuget Sound SalishRomanianRussianSalvadoranSamoanScandinavianScotch-IrishScottishSeminoleSenegaleseSerbianShoshoneSierra LeoneanSiouxSlavicSlovakSloveneSomaliSouth AfricanSouth AmericanSouth American IndianSoviet UnionSpaniardSpanishSpanish AmericanSpanish American IndianSri LankanSubsaharan AfricanSudaneseSwedishSwissSyrianTaiwaneseThaiTlingit-HaidaTohono O'OdhamTonganTrinidadian and TobagonianTsimshianTurkishU.S. Virgin IslanderUgandanUkrainianUruguayanUteVenezuelanVietnameseWelshWest IndianYakamaYaquiYugoslavianYumanYup'ikZimbabwean
Immigration
NonimmigrantsImmigrantsAfghanistanAfricaAlbaniaArgentinaArmeniaAsiaAustraliaAustriaBahamasBangladeshBarbadosBelarusBelgiumBelizeBoliviaBosnia and HerzegovinaBrazilBulgariaBurma/MyanmarCabo VerdeCambodiaCameroonCanadaCaribbeanCentral AmericaChileChinaColombiaCongoCosta RicaCroatiaCubaCzechoslovakiaDenmarkDominicaDominican RepublicEastern AfricaEastern AsiaEastern EuropeEcuadorEgyptEl SalvadorEnglandEritreaEthiopiaEuropeFijiFranceGermanyGhanaGreeceGrenadaGuatemalaGuyanaHaitiHondurasHong KongHungaryIndiaIndonesiaIranIraqIrelandIsraelItalyJamaicaJapanJordanKazakhstanKenyaKoreaKuwaitLaosLatin AmericaLatviaLebanonLiberiaLithuaniaMalaysiaMexicoMicronesiaMiddle AfricaMoldovaMoroccoNepalNetherlandsNicaraguaNigeriaNorth AmericaNorth MacedoniaNorthern AfricaNorthern EuropeNorwayOceaniaPakistanPanamaPeruPhilippinesPolandPortugalRomaniaRussiaSaudi ArabiaScotlandSenegalSerbiaSierra LeoneSingaporeSomaliaSouth AfricaSouth AmericaSouth Central AsiaSouth Eastern AsiaSouthern EuropeSpainSri LankaSt. Vincent and the GrenadinesSudanSwedenSwitzerlandSyriaTaiwanThailandTrinidad and TobagoTurkeyUgandaUkraineUruguayUzbekistanVenezuelaVietnamWest IndiesWestern AfricaWestern AsiaWestern EuropeYemenZaireZimbabweAzores
In Labor Force | Age > 16
Income
Poverty
Unemployment
Labor Participation
Family Structure
Vehicle Availability
Education Level
Disability

In Labor Force | Age > 16 Comparison

Albanians

Immigrants from Northern Africa

Good
Exceptional
65.3%
IN LABOR FORCE | AGE > 16
70.8/ 100
METRIC RATING
162nd/ 347
METRIC RANK
66.6%
IN LABOR FORCE | AGE > 16
100.0/ 100
METRIC RATING
49th/ 347
METRIC RANK

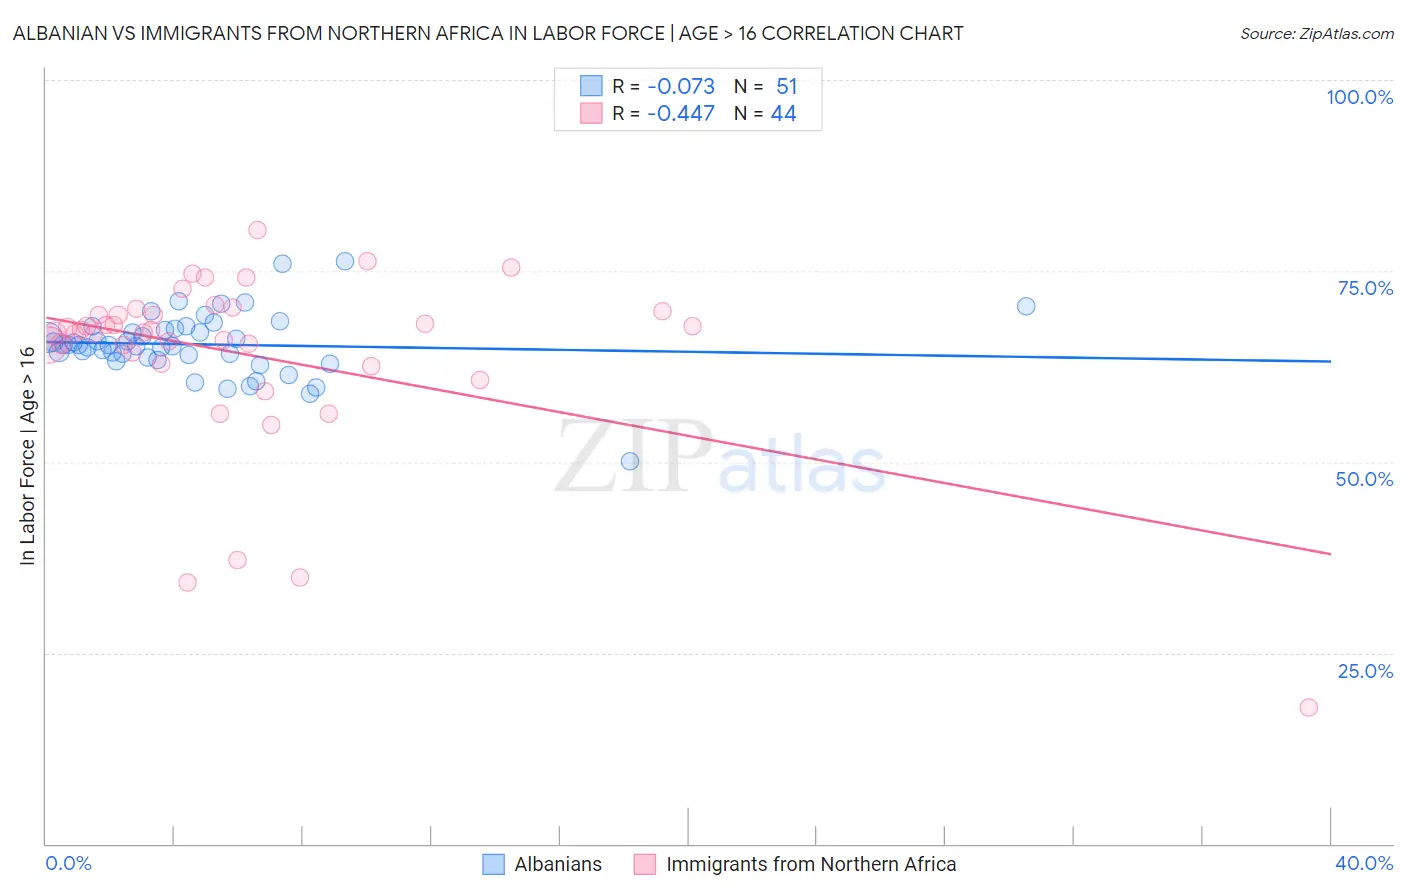
Albanian vs Immigrants from Northern Africa In Labor Force | Age > 16 Correlation Chart

The statistical analysis conducted on geographies consisting of 193,265,279 people shows a slight negative correlation between the proportion of Albanians and labor force participation rate among population ages 16 and over in the United States with a correlation coefficient (R) of -0.073 and weighted average of 65.3%. Similarly, the statistical analysis conducted on geographies consisting of 321,205,048 people shows a moderate negative correlation between the proportion of Immigrants from Northern Africa and labor force participation rate among population ages 16 and over in the United States with a correlation coefficient (R) of -0.447 and weighted average of 66.6%, a difference of 2.0%.
Albanian vs Immigrants from Northern Africa In Labor Force | Age > 16

In Labor Force | Age > 16 Correlation Summary

MeasurementAlbanianImmigrants from Northern Africa
Minimum50.1%17.9%
Maximum76.2%80.4%
Range26.1%62.5%
Mean65.4%64.1%
Median65.3%67.2%
Interquartile 25% (IQ1)63.7%63.6%
Interquartile 75% (IQ3)67.4%69.5%
Interquartile Range (IQR)3.7%5.8%
Standard Deviation (Sample)4.2%12.0%
Standard Deviation (Population)4.2%11.8%

Similar Demographics by In Labor Force | Age > 16

Demographics Similar to Albanians by In Labor Force | Age > 16

In terms of in labor force | age > 16, the demographic groups most similar to Albanians are Australian (65.3%, a difference of 0.010%), South African (65.3%, a difference of 0.010%), Danish (65.3%, a difference of 0.030%), Immigrants from South Africa (65.3%, a difference of 0.040%), and Immigrants from Kazakhstan (65.3%, a difference of 0.040%).
DemographicsRating | RankIn Labor Force | Age > 16
Immigrants | Armenia
76.6
/100
|
#155
Good
65.3%
Immigrants | Ireland
75.9
/100
|
#156
Good
65.3%
Immigrants | Russia
75.7
/100
|
#157
Good
65.3%
Panamanians
75.2
/100
|
#158
Good
65.3%
Immigrants | Syria
74.6
/100
|
#159
Good
65.3%
Immigrants | South Africa
73.5
/100
|
#160
Good
65.3%
Australians
71.3
/100
|
#161
Good
65.3%
Albanians
70.8
/100
|
#162
Good
65.3%
South Africans
69.8
/100
|
#163
Good
65.3%
Danes
68.8
/100
|
#164
Good
65.3%
Immigrants | Kazakhstan
68.1
/100
|
#165
Good
65.3%
Immigrants | Western Asia
67.3
/100
|
#166
Good
65.3%
Immigrants | Belarus
66.0
/100
|
#167
Good
65.2%
Serbians
63.5
/100
|
#168
Good
65.2%
Arabs
62.4
/100
|
#169
Good
65.2%

Demographics Similar to Immigrants from Northern Africa by In Labor Force | Age > 16

In terms of in labor force | age > 16, the demographic groups most similar to Immigrants from Northern Africa are Nigerian (66.6%, a difference of 0.020%), Brazilian (66.6%, a difference of 0.030%), Immigrants from Bulgaria (66.6%, a difference of 0.030%), Cape Verdean (66.6%, a difference of 0.050%), and Immigrants from Brazil (66.7%, a difference of 0.10%).
DemographicsRating | RankIn Labor Force | Age > 16
Senegalese
100.0
/100
|
#42
Exceptional
66.7%
Luxembourgers
100.0
/100
|
#43
Exceptional
66.7%
Immigrants | Pakistan
100.0
/100
|
#44
Exceptional
66.7%
Immigrants | Brazil
100.0
/100
|
#45
Exceptional
66.7%
Brazilians
100.0
/100
|
#46
Exceptional
66.6%
Immigrants | Bulgaria
100.0
/100
|
#47
Exceptional
66.6%
Nigerians
100.0
/100
|
#48
Exceptional
66.6%
Immigrants | Northern Africa
100.0
/100
|
#49
Exceptional
66.6%
Cape Verdeans
100.0
/100
|
#50
Exceptional
66.6%
Immigrants | Kuwait
100.0
/100
|
#51
Exceptional
66.5%
Paraguayans
99.9
/100
|
#52
Exceptional
66.5%
Immigrants | Sri Lanka
99.9
/100
|
#53
Exceptional
66.5%
Immigrants | Bosnia and Herzegovina
99.9
/100
|
#54
Exceptional
66.5%
Immigrants | Venezuela
99.9
/100
|
#55
Exceptional
66.4%
Immigrants | Senegal
99.9
/100
|
#56
Exceptional
66.4%