Albanian vs Houma In Labor Force | Age > 16
COMPARE
Albanian
Houma
In Labor Force | Age > 16
In Labor Force | Age > 16 Comparison
Albanians
Houma
65.3%
IN LABOR FORCE | AGE > 16
70.8/ 100
METRIC RATING
162nd/ 347
METRIC RANK
59.5%
IN LABOR FORCE | AGE > 16
0.0/ 100
METRIC RATING
339th/ 347
METRIC RANK
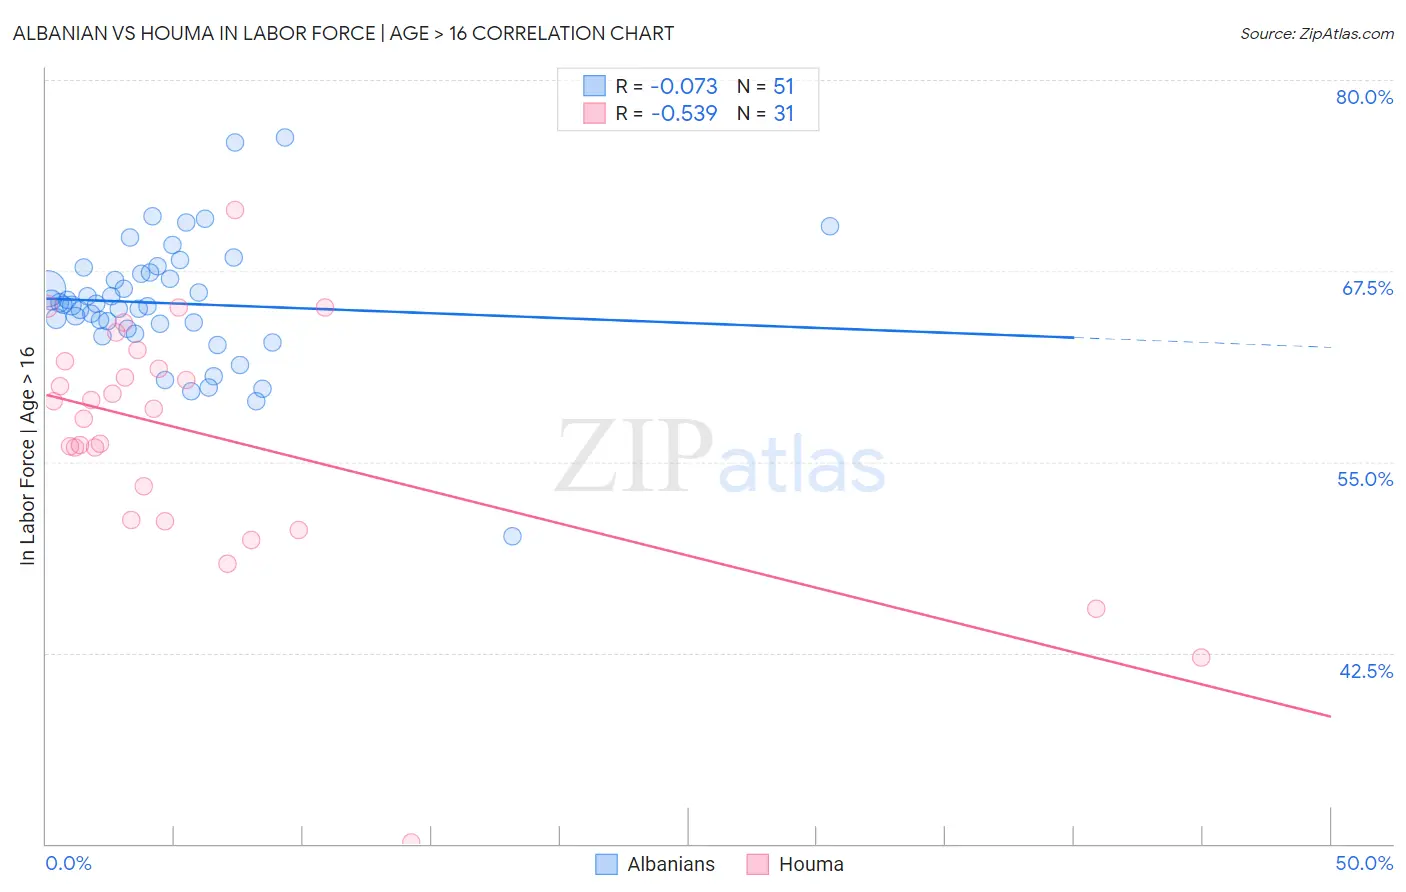
Albanian vs Houma In Labor Force | Age > 16 Correlation Chart
The statistical analysis conducted on geographies consisting of 193,265,279 people shows a slight negative correlation between the proportion of Albanians and labor force participation rate among population ages 16 and over in the United States with a correlation coefficient (R) of -0.073 and weighted average of 65.3%. Similarly, the statistical analysis conducted on geographies consisting of 36,799,095 people shows a substantial negative correlation between the proportion of Houma and labor force participation rate among population ages 16 and over in the United States with a correlation coefficient (R) of -0.539 and weighted average of 59.5%, a difference of 9.7%.
In Labor Force | Age > 16 Correlation Summary
| Measurement | Albanian | Houma |
| Minimum | 50.1% | 30.1% |
| Maximum | 76.2% | 71.5% |
| Range | 26.1% | 41.4% |
| Mean | 65.4% | 56.7% |
| Median | 65.3% | 58.5% |
| Interquartile 25% (IQ1) | 63.7% | 51.2% |
| Interquartile 75% (IQ3) | 67.4% | 61.6% |
| Interquartile Range (IQR) | 3.7% | 10.4% |
| Standard Deviation (Sample) | 4.2% | 8.1% |
| Standard Deviation (Population) | 4.2% | 7.9% |
Similar Demographics by In Labor Force | Age > 16
Demographics Similar to Albanians by In Labor Force | Age > 16
In terms of in labor force | age > 16, the demographic groups most similar to Albanians are Australian (65.3%, a difference of 0.010%), South African (65.3%, a difference of 0.010%), Danish (65.3%, a difference of 0.030%), Immigrants from South Africa (65.3%, a difference of 0.040%), and Immigrants from Kazakhstan (65.3%, a difference of 0.040%).
| Demographics | Rating | Rank | In Labor Force | Age > 16 |
| Immigrants | Armenia | 76.6 /100 | #155 | Good 65.3% |
| Immigrants | Ireland | 75.9 /100 | #156 | Good 65.3% |
| Immigrants | Russia | 75.7 /100 | #157 | Good 65.3% |
| Panamanians | 75.2 /100 | #158 | Good 65.3% |
| Immigrants | Syria | 74.6 /100 | #159 | Good 65.3% |
| Immigrants | South Africa | 73.5 /100 | #160 | Good 65.3% |
| Australians | 71.3 /100 | #161 | Good 65.3% |
| Albanians | 70.8 /100 | #162 | Good 65.3% |
| South Africans | 69.8 /100 | #163 | Good 65.3% |
| Danes | 68.8 /100 | #164 | Good 65.3% |
| Immigrants | Kazakhstan | 68.1 /100 | #165 | Good 65.3% |
| Immigrants | Western Asia | 67.3 /100 | #166 | Good 65.3% |
| Immigrants | Belarus | 66.0 /100 | #167 | Good 65.2% |
| Serbians | 63.5 /100 | #168 | Good 65.2% |
| Arabs | 62.4 /100 | #169 | Good 65.2% |
Demographics Similar to Houma by In Labor Force | Age > 16
In terms of in labor force | age > 16, the demographic groups most similar to Houma are Immigrants from Yemen (59.6%, a difference of 0.25%), Pueblo (59.3%, a difference of 0.39%), Colville (59.8%, a difference of 0.52%), Menominee (60.6%, a difference of 1.8%), and Native/Alaskan (60.6%, a difference of 1.8%).
| Demographics | Rating | Rank | In Labor Force | Age > 16 |
| Crow | 0.0 /100 | #332 | Tragic 60.8% |
| Paiute | 0.0 /100 | #333 | Tragic 60.7% |
| Apache | 0.0 /100 | #334 | Tragic 60.7% |
| Natives/Alaskans | 0.0 /100 | #335 | Tragic 60.6% |
| Menominee | 0.0 /100 | #336 | Tragic 60.6% |
| Colville | 0.0 /100 | #337 | Tragic 59.8% |
| Immigrants | Yemen | 0.0 /100 | #338 | Tragic 59.6% |
| Houma | 0.0 /100 | #339 | Tragic 59.5% |
| Pueblo | 0.0 /100 | #340 | Tragic 59.3% |
| Hopi | 0.0 /100 | #341 | Tragic 58.4% |
| Puerto Ricans | 0.0 /100 | #342 | Tragic 58.1% |
| Yuman | 0.0 /100 | #343 | Tragic 57.8% |
| Pima | 0.0 /100 | #344 | Tragic 57.4% |
| Tohono O'odham | 0.0 /100 | #345 | Tragic 57.2% |
| Lumbee | 0.0 /100 | #346 | Tragic 56.8% |