Immigrants from Pakistan vs Immigrants from Dominican Republic In Labor Force | Age > 16
COMPARE
Immigrants from Pakistan
Immigrants from Dominican Republic
In Labor Force | Age > 16
In Labor Force | Age > 16 Comparison
Immigrants from Pakistan
Immigrants from Dominican Republic
66.7%
IN LABOR FORCE | AGE > 16
100.0/ 100
METRIC RATING
44th/ 347
METRIC RANK
64.4%
IN LABOR FORCE | AGE > 16
1.5/ 100
METRIC RATING
252nd/ 347
METRIC RANK
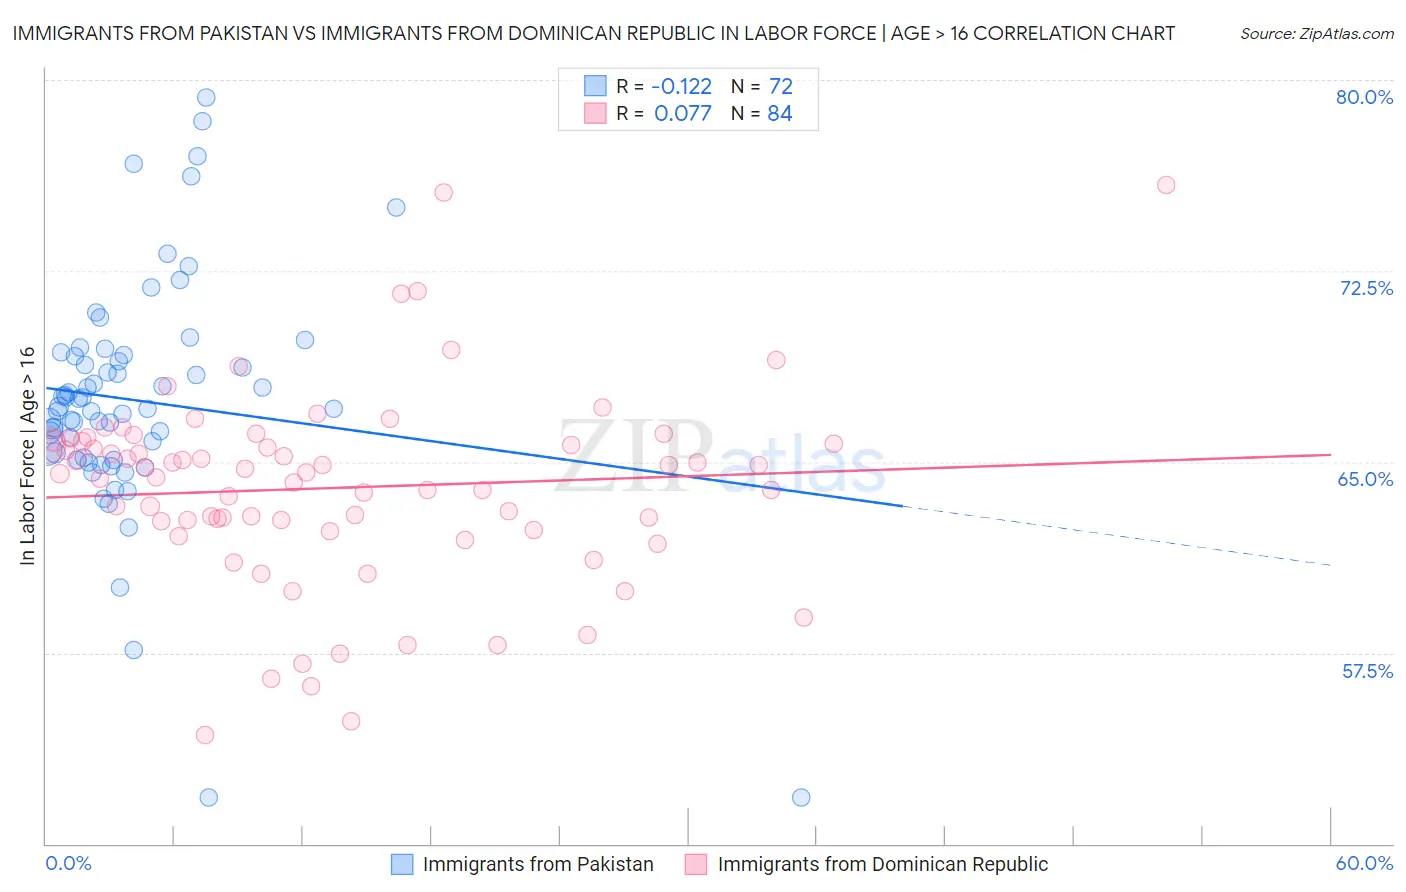
Immigrants from Pakistan vs Immigrants from Dominican Republic In Labor Force | Age > 16 Correlation Chart
The statistical analysis conducted on geographies consisting of 283,909,562 people shows a poor negative correlation between the proportion of Immigrants from Pakistan and labor force participation rate among population ages 16 and over in the United States with a correlation coefficient (R) of -0.122 and weighted average of 66.7%. Similarly, the statistical analysis conducted on geographies consisting of 275,136,477 people shows a slight positive correlation between the proportion of Immigrants from Dominican Republic and labor force participation rate among population ages 16 and over in the United States with a correlation coefficient (R) of 0.077 and weighted average of 64.4%, a difference of 3.6%.
In Labor Force | Age > 16 Correlation Summary
| Measurement | Immigrants from Pakistan | Immigrants from Dominican Republic |
| Minimum | 51.8% | 54.3% |
| Maximum | 79.3% | 75.9% |
| Range | 27.5% | 21.6% |
| Mean | 67.4% | 64.0% |
| Median | 67.1% | 64.6% |
| Interquartile 25% (IQ1) | 65.3% | 62.5% |
| Interquartile 75% (IQ3) | 69.2% | 65.7% |
| Interquartile Range (IQR) | 3.9% | 3.3% |
| Standard Deviation (Sample) | 4.7% | 3.8% |
| Standard Deviation (Population) | 4.6% | 3.8% |
Similar Demographics by In Labor Force | Age > 16
Demographics Similar to Immigrants from Pakistan by In Labor Force | Age > 16
In terms of in labor force | age > 16, the demographic groups most similar to Immigrants from Pakistan are Luxembourger (66.7%, a difference of 0.050%), Immigrants from Brazil (66.7%, a difference of 0.050%), Senegalese (66.7%, a difference of 0.070%), Brazilian (66.6%, a difference of 0.12%), and Immigrants from Bulgaria (66.6%, a difference of 0.12%).
| Demographics | Rating | Rank | In Labor Force | Age > 16 |
| Immigrants | Afghanistan | 100.0 /100 | #37 | Exceptional 67.0% |
| Immigrants | Nigeria | 100.0 /100 | #38 | Exceptional 66.9% |
| Salvadorans | 100.0 /100 | #39 | Exceptional 66.8% |
| Immigrants | El Salvador | 100.0 /100 | #40 | Exceptional 66.8% |
| Immigrants | Zimbabwe | 100.0 /100 | #41 | Exceptional 66.8% |
| Senegalese | 100.0 /100 | #42 | Exceptional 66.7% |
| Luxembourgers | 100.0 /100 | #43 | Exceptional 66.7% |
| Immigrants | Pakistan | 100.0 /100 | #44 | Exceptional 66.7% |
| Immigrants | Brazil | 100.0 /100 | #45 | Exceptional 66.7% |
| Brazilians | 100.0 /100 | #46 | Exceptional 66.6% |
| Immigrants | Bulgaria | 100.0 /100 | #47 | Exceptional 66.6% |
| Nigerians | 100.0 /100 | #48 | Exceptional 66.6% |
| Immigrants | Northern Africa | 100.0 /100 | #49 | Exceptional 66.6% |
| Cape Verdeans | 100.0 /100 | #50 | Exceptional 66.6% |
| Immigrants | Kuwait | 100.0 /100 | #51 | Exceptional 66.5% |
Demographics Similar to Immigrants from Dominican Republic by In Labor Force | Age > 16
In terms of in labor force | age > 16, the demographic groups most similar to Immigrants from Dominican Republic are Czechoslovakian (64.3%, a difference of 0.010%), Immigrants from Uzbekistan (64.3%, a difference of 0.010%), Portuguese (64.4%, a difference of 0.030%), British West Indian (64.4%, a difference of 0.050%), and German (64.4%, a difference of 0.060%).
| Demographics | Rating | Rank | In Labor Force | Age > 16 |
| West Indians | 3.0 /100 | #245 | Tragic 64.5% |
| Immigrants | Caribbean | 2.3 /100 | #246 | Tragic 64.4% |
| Swiss | 2.1 /100 | #247 | Tragic 64.4% |
| Immigrants | Barbados | 2.1 /100 | #248 | Tragic 64.4% |
| Germans | 1.8 /100 | #249 | Tragic 64.4% |
| British West Indians | 1.8 /100 | #250 | Tragic 64.4% |
| Portuguese | 1.6 /100 | #251 | Tragic 64.4% |
| Immigrants | Dominican Republic | 1.5 /100 | #252 | Tragic 64.4% |
| Czechoslovakians | 1.4 /100 | #253 | Tragic 64.3% |
| Immigrants | Uzbekistan | 1.4 /100 | #254 | Tragic 64.3% |
| Hispanics or Latinos | 1.1 /100 | #255 | Tragic 64.3% |
| Immigrants | Mexico | 1.0 /100 | #256 | Tragic 64.3% |
| Inupiat | 0.8 /100 | #257 | Tragic 64.3% |
| Immigrants | Scotland | 0.8 /100 | #258 | Tragic 64.2% |
| Immigrants | Western Europe | 0.7 /100 | #259 | Tragic 64.2% |