Scottish vs Immigrants from Dominican Republic In Labor Force | Age > 16
COMPARE
Scottish
Immigrants from Dominican Republic
In Labor Force | Age > 16
In Labor Force | Age > 16 Comparison
Scottish
Immigrants from Dominican Republic
63.9%
IN LABOR FORCE | AGE > 16
0.1/ 100
METRIC RATING
287th/ 347
METRIC RANK
64.4%
IN LABOR FORCE | AGE > 16
1.5/ 100
METRIC RATING
252nd/ 347
METRIC RANK
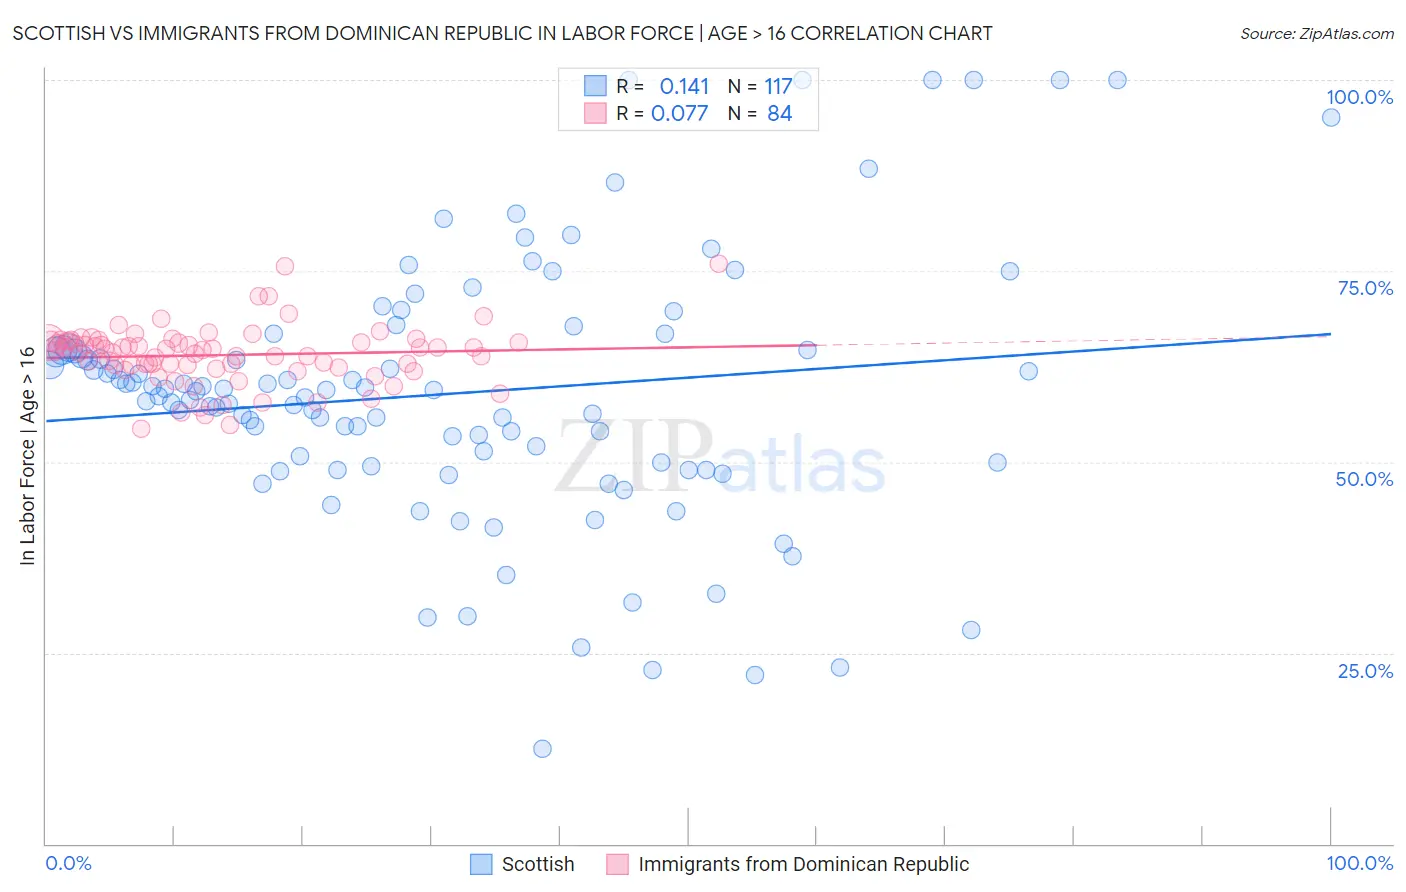
Scottish vs Immigrants from Dominican Republic In Labor Force | Age > 16 Correlation Chart
The statistical analysis conducted on geographies consisting of 567,155,929 people shows a poor positive correlation between the proportion of Scottish and labor force participation rate among population ages 16 and over in the United States with a correlation coefficient (R) of 0.141 and weighted average of 63.9%. Similarly, the statistical analysis conducted on geographies consisting of 275,136,477 people shows a slight positive correlation between the proportion of Immigrants from Dominican Republic and labor force participation rate among population ages 16 and over in the United States with a correlation coefficient (R) of 0.077 and weighted average of 64.4%, a difference of 0.74%.
In Labor Force | Age > 16 Correlation Summary
| Measurement | Scottish | Immigrants from Dominican Republic |
| Minimum | 12.5% | 54.3% |
| Maximum | 100.0% | 75.9% |
| Range | 87.5% | 21.6% |
| Mean | 58.9% | 64.0% |
| Median | 59.3% | 64.6% |
| Interquartile 25% (IQ1) | 49.7% | 62.5% |
| Interquartile 75% (IQ3) | 64.8% | 65.7% |
| Interquartile Range (IQR) | 15.1% | 3.3% |
| Standard Deviation (Sample) | 17.1% | 3.8% |
| Standard Deviation (Population) | 17.1% | 3.8% |
Similar Demographics by In Labor Force | Age > 16
Demographics Similar to Scottish by In Labor Force | Age > 16
In terms of in labor force | age > 16, the demographic groups most similar to Scottish are Immigrants from Austria (63.9%, a difference of 0.0%), Slovak (63.9%, a difference of 0.030%), Spanish (63.9%, a difference of 0.050%), French (63.9%, a difference of 0.060%), and Immigrants from Germany (63.9%, a difference of 0.070%).
| Demographics | Rating | Rank | In Labor Force | Age > 16 |
| Immigrants | St. Vincent and the Grenadines | 0.2 /100 | #280 | Tragic 64.0% |
| French Canadians | 0.2 /100 | #281 | Tragic 64.0% |
| Immigrants | Guyana | 0.2 /100 | #282 | Tragic 64.0% |
| Immigrants | Germany | 0.1 /100 | #283 | Tragic 63.9% |
| French | 0.1 /100 | #284 | Tragic 63.9% |
| Slovaks | 0.1 /100 | #285 | Tragic 63.9% |
| Immigrants | Austria | 0.1 /100 | #286 | Tragic 63.9% |
| Scottish | 0.1 /100 | #287 | Tragic 63.9% |
| Spanish | 0.1 /100 | #288 | Tragic 63.9% |
| Celtics | 0.1 /100 | #289 | Tragic 63.8% |
| Hungarians | 0.1 /100 | #290 | Tragic 63.8% |
| Nepalese | 0.1 /100 | #291 | Tragic 63.8% |
| Spanish American Indians | 0.1 /100 | #292 | Tragic 63.8% |
| English | 0.1 /100 | #293 | Tragic 63.7% |
| Puget Sound Salish | 0.0 /100 | #294 | Tragic 63.7% |
Demographics Similar to Immigrants from Dominican Republic by In Labor Force | Age > 16
In terms of in labor force | age > 16, the demographic groups most similar to Immigrants from Dominican Republic are Czechoslovakian (64.3%, a difference of 0.010%), Immigrants from Uzbekistan (64.3%, a difference of 0.010%), Portuguese (64.4%, a difference of 0.030%), British West Indian (64.4%, a difference of 0.050%), and German (64.4%, a difference of 0.060%).
| Demographics | Rating | Rank | In Labor Force | Age > 16 |
| West Indians | 3.0 /100 | #245 | Tragic 64.5% |
| Immigrants | Caribbean | 2.3 /100 | #246 | Tragic 64.4% |
| Swiss | 2.1 /100 | #247 | Tragic 64.4% |
| Immigrants | Barbados | 2.1 /100 | #248 | Tragic 64.4% |
| Germans | 1.8 /100 | #249 | Tragic 64.4% |
| British West Indians | 1.8 /100 | #250 | Tragic 64.4% |
| Portuguese | 1.6 /100 | #251 | Tragic 64.4% |
| Immigrants | Dominican Republic | 1.5 /100 | #252 | Tragic 64.4% |
| Czechoslovakians | 1.4 /100 | #253 | Tragic 64.3% |
| Immigrants | Uzbekistan | 1.4 /100 | #254 | Tragic 64.3% |
| Hispanics or Latinos | 1.1 /100 | #255 | Tragic 64.3% |
| Immigrants | Mexico | 1.0 /100 | #256 | Tragic 64.3% |
| Inupiat | 0.8 /100 | #257 | Tragic 64.3% |
| Immigrants | Scotland | 0.8 /100 | #258 | Tragic 64.2% |
| Immigrants | Western Europe | 0.7 /100 | #259 | Tragic 64.2% |