Alaskan Athabascan vs Spanish American In Labor Force | Age 35-44
COMPARE
Alaskan Athabascan
Spanish American
In Labor Force | Age 35-44
In Labor Force | Age 35-44 Comparison
Alaskan Athabascans
Spanish Americans
81.3%
IN LABOR FORCE | AGE 35-44
0.0/ 100
METRIC RATING
318th/ 347
METRIC RANK
82.8%
IN LABOR FORCE | AGE 35-44
0.0/ 100
METRIC RATING
293rd/ 347
METRIC RANK
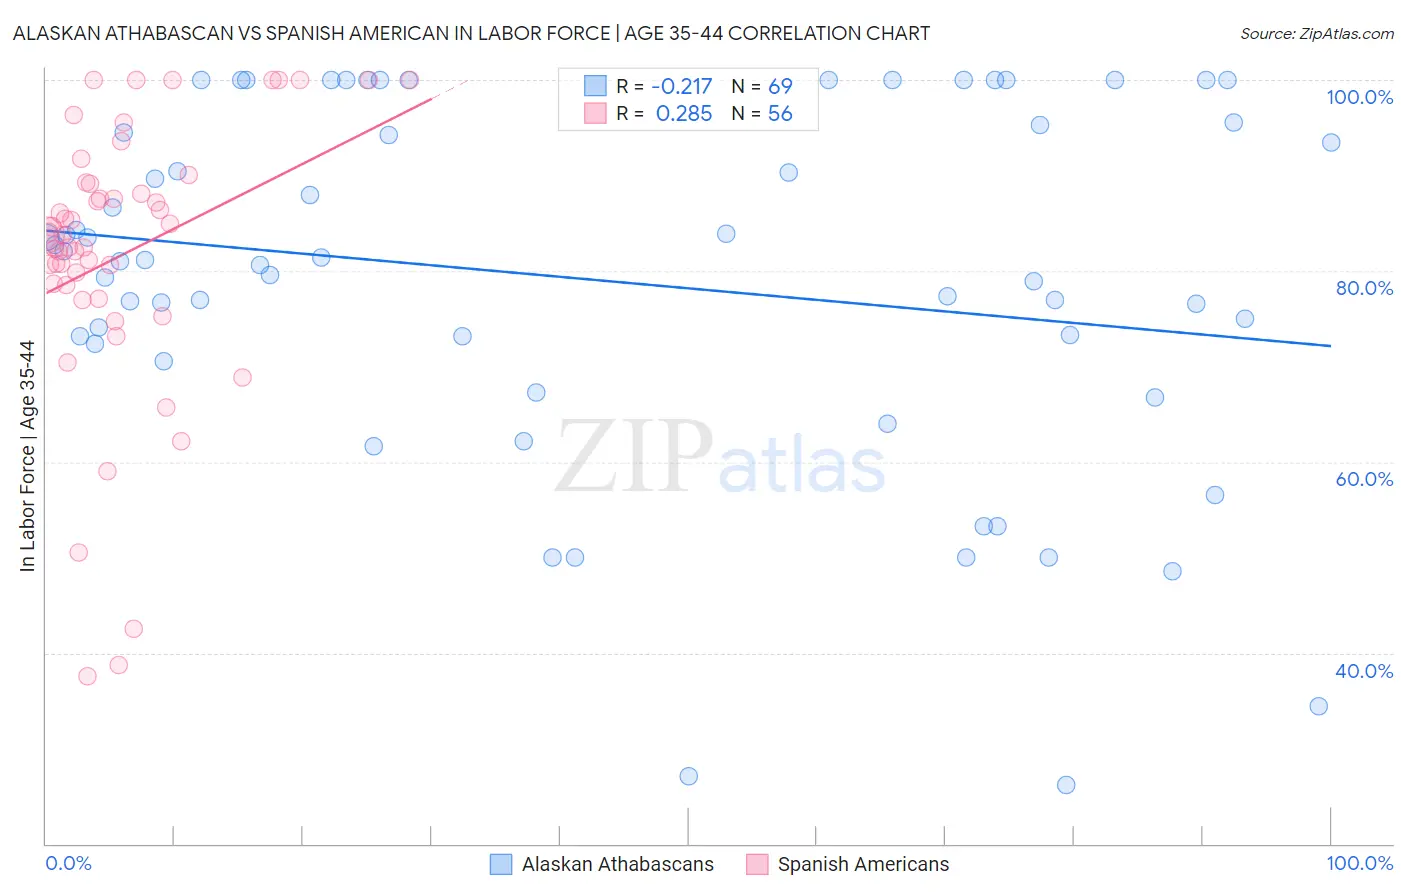
Alaskan Athabascan vs Spanish American In Labor Force | Age 35-44 Correlation Chart
The statistical analysis conducted on geographies consisting of 45,819,341 people shows a weak negative correlation between the proportion of Alaskan Athabascans and labor force participation rate among population between the ages 35 and 44 in the United States with a correlation coefficient (R) of -0.217 and weighted average of 81.3%. Similarly, the statistical analysis conducted on geographies consisting of 103,164,815 people shows a weak positive correlation between the proportion of Spanish Americans and labor force participation rate among population between the ages 35 and 44 in the United States with a correlation coefficient (R) of 0.285 and weighted average of 82.8%, a difference of 1.8%.
In Labor Force | Age 35-44 Correlation Summary
| Measurement | Alaskan Athabascan | Spanish American |
| Minimum | 26.1% | 37.5% |
| Maximum | 100.0% | 100.0% |
| Range | 73.9% | 62.5% |
| Mean | 79.1% | 81.7% |
| Median | 81.2% | 83.8% |
| Interquartile 25% (IQ1) | 71.5% | 77.8% |
| Interquartile 75% (IQ3) | 95.4% | 89.2% |
| Interquartile Range (IQR) | 23.9% | 11.4% |
| Standard Deviation (Sample) | 18.8% | 14.6% |
| Standard Deviation (Population) | 18.6% | 14.5% |
Similar Demographics by In Labor Force | Age 35-44
Demographics Similar to Alaskan Athabascans by In Labor Force | Age 35-44
In terms of in labor force | age 35-44, the demographic groups most similar to Alaskan Athabascans are Cherokee (81.4%, a difference of 0.12%), Comanche (81.5%, a difference of 0.20%), Immigrants from Mexico (81.5%, a difference of 0.22%), Cajun (81.5%, a difference of 0.25%), and Alaska Native (81.6%, a difference of 0.36%).
| Demographics | Rating | Rank | In Labor Force | Age 35-44 |
| Colville | 0.0 /100 | #311 | Tragic 81.7% |
| Alaska Natives | 0.0 /100 | #312 | Tragic 81.6% |
| Mexicans | 0.0 /100 | #313 | Tragic 81.6% |
| Cajuns | 0.0 /100 | #314 | Tragic 81.5% |
| Immigrants | Mexico | 0.0 /100 | #315 | Tragic 81.5% |
| Comanche | 0.0 /100 | #316 | Tragic 81.5% |
| Cherokee | 0.0 /100 | #317 | Tragic 81.4% |
| Alaskan Athabascans | 0.0 /100 | #318 | Tragic 81.3% |
| Inupiat | 0.0 /100 | #319 | Tragic 80.9% |
| Chickasaw | 0.0 /100 | #320 | Tragic 80.9% |
| Puerto Ricans | 0.0 /100 | #321 | Tragic 80.7% |
| Paiute | 0.0 /100 | #322 | Tragic 80.6% |
| Yaqui | 0.0 /100 | #323 | Tragic 80.5% |
| Choctaw | 0.0 /100 | #324 | Tragic 80.5% |
| Dutch West Indians | 0.0 /100 | #325 | Tragic 80.4% |
Demographics Similar to Spanish Americans by In Labor Force | Age 35-44
In terms of in labor force | age 35-44, the demographic groups most similar to Spanish Americans are Potawatomi (82.7%, a difference of 0.080%), Immigrants from Latin America (82.8%, a difference of 0.090%), Immigrants from Lebanon (82.7%, a difference of 0.13%), Pennsylvania German (82.9%, a difference of 0.14%), and African (82.9%, a difference of 0.16%).
| Demographics | Rating | Rank | In Labor Force | Age 35-44 |
| Immigrants | Bangladesh | 0.0 /100 | #286 | Tragic 82.9% |
| Immigrants | Belize | 0.0 /100 | #287 | Tragic 82.9% |
| Puget Sound Salish | 0.0 /100 | #288 | Tragic 82.9% |
| Chippewa | 0.0 /100 | #289 | Tragic 82.9% |
| Africans | 0.0 /100 | #290 | Tragic 82.9% |
| Pennsylvania Germans | 0.0 /100 | #291 | Tragic 82.9% |
| Immigrants | Latin America | 0.0 /100 | #292 | Tragic 82.8% |
| Spanish Americans | 0.0 /100 | #293 | Tragic 82.8% |
| Potawatomi | 0.0 /100 | #294 | Tragic 82.7% |
| Immigrants | Lebanon | 0.0 /100 | #295 | Tragic 82.7% |
| Mexican American Indians | 0.0 /100 | #296 | Tragic 82.6% |
| Hmong | 0.0 /100 | #297 | Tragic 82.6% |
| Ottawa | 0.0 /100 | #298 | Tragic 82.6% |
| Tlingit-Haida | 0.0 /100 | #299 | Tragic 82.5% |
| Central American Indians | 0.0 /100 | #300 | Tragic 82.5% |