Alaskan Athabascan vs Immigrants from South Eastern Asia In Labor Force | Age 35-44
COMPARE
Alaskan Athabascan
Immigrants from South Eastern Asia
In Labor Force | Age 35-44
In Labor Force | Age 35-44 Comparison
Alaskan Athabascans
Immigrants from South Eastern Asia
81.3%
IN LABOR FORCE | AGE 35-44
0.0/ 100
METRIC RATING
318th/ 347
METRIC RANK
84.2%
IN LABOR FORCE | AGE 35-44
22.4/ 100
METRIC RATING
203rd/ 347
METRIC RANK
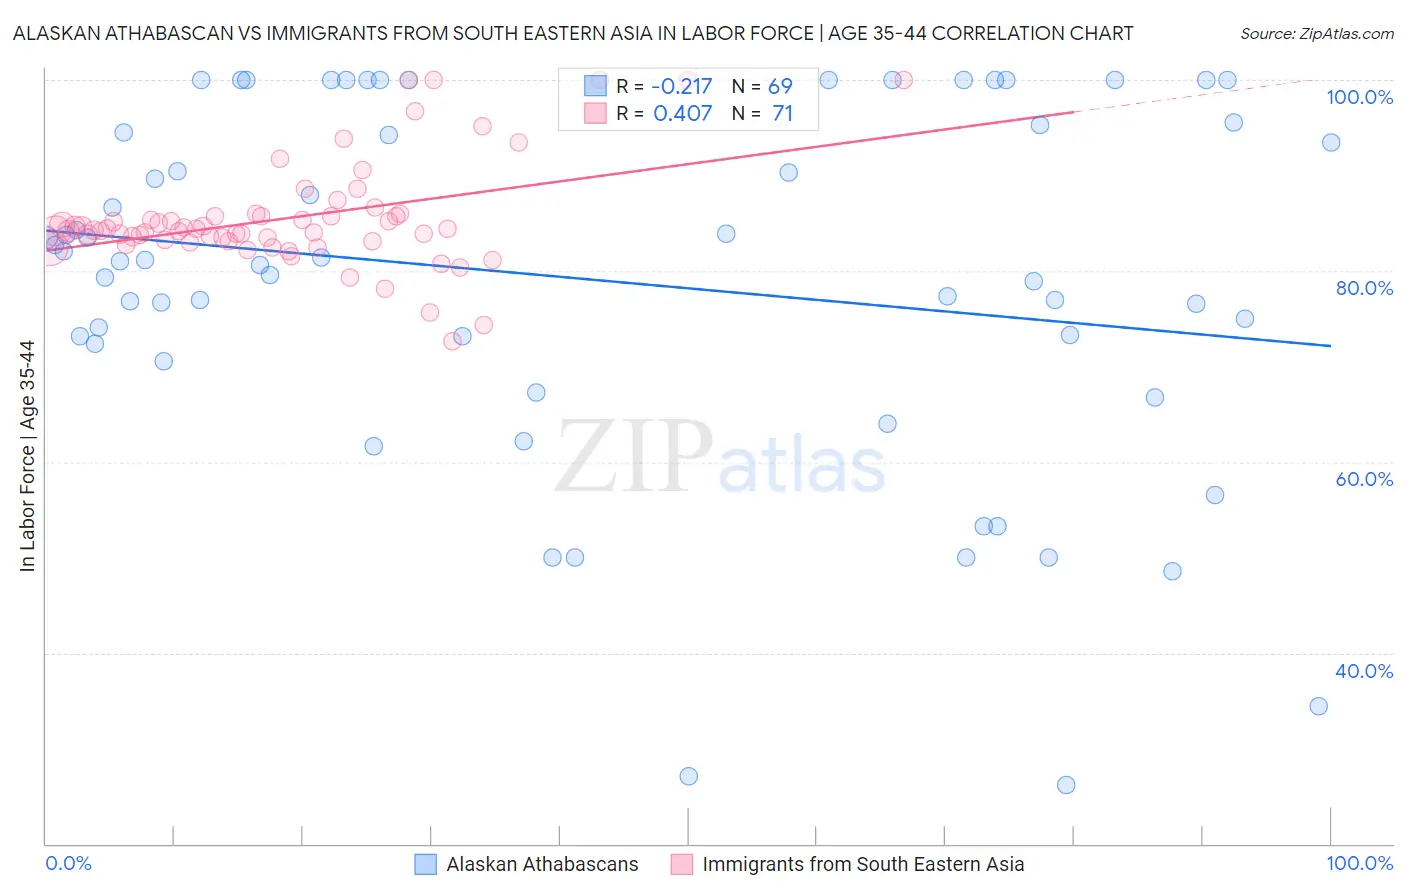
Alaskan Athabascan vs Immigrants from South Eastern Asia In Labor Force | Age 35-44 Correlation Chart
The statistical analysis conducted on geographies consisting of 45,819,341 people shows a weak negative correlation between the proportion of Alaskan Athabascans and labor force participation rate among population between the ages 35 and 44 in the United States with a correlation coefficient (R) of -0.217 and weighted average of 81.3%. Similarly, the statistical analysis conducted on geographies consisting of 512,357,039 people shows a moderate positive correlation between the proportion of Immigrants from South Eastern Asia and labor force participation rate among population between the ages 35 and 44 in the United States with a correlation coefficient (R) of 0.407 and weighted average of 84.2%, a difference of 3.6%.
In Labor Force | Age 35-44 Correlation Summary
| Measurement | Alaskan Athabascan | Immigrants from South Eastern Asia |
| Minimum | 26.1% | 72.7% |
| Maximum | 100.0% | 100.0% |
| Range | 73.9% | 27.3% |
| Mean | 79.1% | 85.5% |
| Median | 81.2% | 84.3% |
| Interquartile 25% (IQ1) | 71.5% | 83.1% |
| Interquartile 75% (IQ3) | 95.4% | 85.8% |
| Interquartile Range (IQR) | 23.9% | 2.6% |
| Standard Deviation (Sample) | 18.8% | 5.6% |
| Standard Deviation (Population) | 18.6% | 5.6% |
Similar Demographics by In Labor Force | Age 35-44
Demographics Similar to Alaskan Athabascans by In Labor Force | Age 35-44
In terms of in labor force | age 35-44, the demographic groups most similar to Alaskan Athabascans are Cherokee (81.4%, a difference of 0.12%), Comanche (81.5%, a difference of 0.20%), Immigrants from Mexico (81.5%, a difference of 0.22%), Cajun (81.5%, a difference of 0.25%), and Alaska Native (81.6%, a difference of 0.36%).
| Demographics | Rating | Rank | In Labor Force | Age 35-44 |
| Colville | 0.0 /100 | #311 | Tragic 81.7% |
| Alaska Natives | 0.0 /100 | #312 | Tragic 81.6% |
| Mexicans | 0.0 /100 | #313 | Tragic 81.6% |
| Cajuns | 0.0 /100 | #314 | Tragic 81.5% |
| Immigrants | Mexico | 0.0 /100 | #315 | Tragic 81.5% |
| Comanche | 0.0 /100 | #316 | Tragic 81.5% |
| Cherokee | 0.0 /100 | #317 | Tragic 81.4% |
| Alaskan Athabascans | 0.0 /100 | #318 | Tragic 81.3% |
| Inupiat | 0.0 /100 | #319 | Tragic 80.9% |
| Chickasaw | 0.0 /100 | #320 | Tragic 80.9% |
| Puerto Ricans | 0.0 /100 | #321 | Tragic 80.7% |
| Paiute | 0.0 /100 | #322 | Tragic 80.6% |
| Yaqui | 0.0 /100 | #323 | Tragic 80.5% |
| Choctaw | 0.0 /100 | #324 | Tragic 80.5% |
| Dutch West Indians | 0.0 /100 | #325 | Tragic 80.4% |
Demographics Similar to Immigrants from South Eastern Asia by In Labor Force | Age 35-44
In terms of in labor force | age 35-44, the demographic groups most similar to Immigrants from South Eastern Asia are Immigrants from Uzbekistan (84.2%, a difference of 0.0%), Ecuadorian (84.2%, a difference of 0.010%), Syrian (84.2%, a difference of 0.010%), Moroccan (84.2%, a difference of 0.010%), and British (84.2%, a difference of 0.010%).
| Demographics | Rating | Rank | In Labor Force | Age 35-44 |
| Immigrants | England | 25.0 /100 | #196 | Fair 84.2% |
| Immigrants | Western Europe | 24.7 /100 | #197 | Fair 84.2% |
| Ecuadorians | 24.0 /100 | #198 | Fair 84.2% |
| Syrians | 23.2 /100 | #199 | Fair 84.2% |
| Moroccans | 23.2 /100 | #200 | Fair 84.2% |
| British | 23.0 /100 | #201 | Fair 84.2% |
| Immigrants | Uzbekistan | 22.8 /100 | #202 | Fair 84.2% |
| Immigrants | South Eastern Asia | 22.4 /100 | #203 | Fair 84.2% |
| Canadians | 19.9 /100 | #204 | Poor 84.2% |
| Immigrants | Canada | 19.6 /100 | #205 | Poor 84.2% |
| Immigrants | Costa Rica | 19.5 /100 | #206 | Poor 84.2% |
| Laotians | 19.0 /100 | #207 | Poor 84.2% |
| Immigrants | North America | 18.1 /100 | #208 | Poor 84.2% |
| Swiss | 17.4 /100 | #209 | Poor 84.2% |
| New Zealanders | 16.2 /100 | #210 | Poor 84.1% |