Alaskan Athabascan vs Slovak In Labor Force | Age 35-44
COMPARE
Alaskan Athabascan
Slovak
In Labor Force | Age 35-44
In Labor Force | Age 35-44 Comparison
Alaskan Athabascans
Slovaks
81.3%
IN LABOR FORCE | AGE 35-44
0.0/ 100
METRIC RATING
318th/ 347
METRIC RANK
85.1%
IN LABOR FORCE | AGE 35-44
99.4/ 100
METRIC RATING
58th/ 347
METRIC RANK
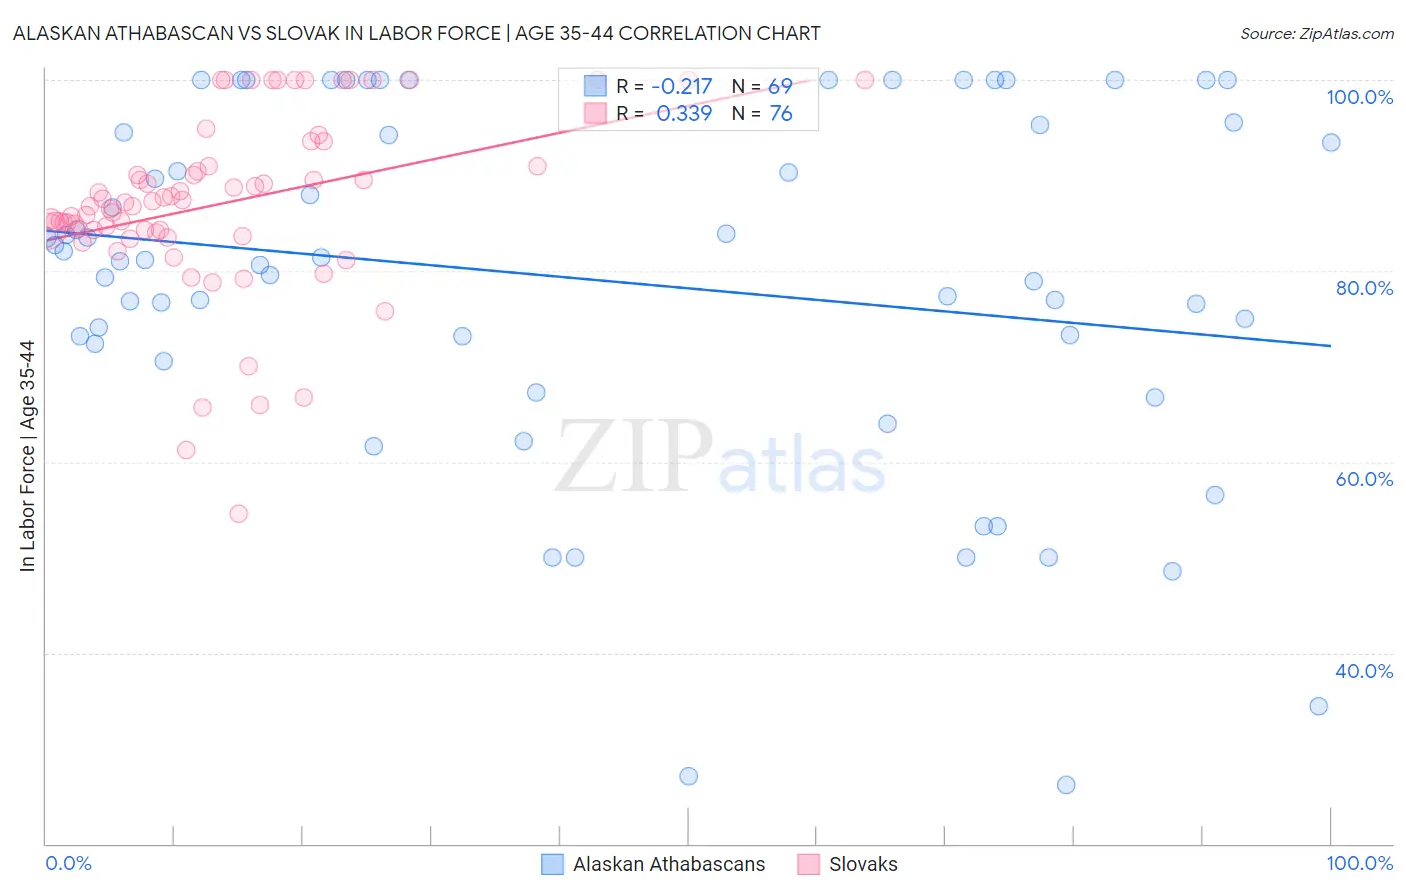
Alaskan Athabascan vs Slovak In Labor Force | Age 35-44 Correlation Chart
The statistical analysis conducted on geographies consisting of 45,819,341 people shows a weak negative correlation between the proportion of Alaskan Athabascans and labor force participation rate among population between the ages 35 and 44 in the United States with a correlation coefficient (R) of -0.217 and weighted average of 81.3%. Similarly, the statistical analysis conducted on geographies consisting of 397,675,153 people shows a mild positive correlation between the proportion of Slovaks and labor force participation rate among population between the ages 35 and 44 in the United States with a correlation coefficient (R) of 0.339 and weighted average of 85.1%, a difference of 4.6%.
In Labor Force | Age 35-44 Correlation Summary
| Measurement | Alaskan Athabascan | Slovak |
| Minimum | 26.1% | 54.6% |
| Maximum | 100.0% | 100.0% |
| Range | 73.9% | 45.4% |
| Mean | 79.1% | 87.0% |
| Median | 81.2% | 87.0% |
| Interquartile 25% (IQ1) | 71.5% | 84.1% |
| Interquartile 75% (IQ3) | 95.4% | 91.0% |
| Interquartile Range (IQR) | 23.9% | 6.9% |
| Standard Deviation (Sample) | 18.8% | 9.4% |
| Standard Deviation (Population) | 18.6% | 9.3% |
Similar Demographics by In Labor Force | Age 35-44
Demographics Similar to Alaskan Athabascans by In Labor Force | Age 35-44
In terms of in labor force | age 35-44, the demographic groups most similar to Alaskan Athabascans are Cherokee (81.4%, a difference of 0.12%), Comanche (81.5%, a difference of 0.20%), Immigrants from Mexico (81.5%, a difference of 0.22%), Cajun (81.5%, a difference of 0.25%), and Alaska Native (81.6%, a difference of 0.36%).
| Demographics | Rating | Rank | In Labor Force | Age 35-44 |
| Colville | 0.0 /100 | #311 | Tragic 81.7% |
| Alaska Natives | 0.0 /100 | #312 | Tragic 81.6% |
| Mexicans | 0.0 /100 | #313 | Tragic 81.6% |
| Cajuns | 0.0 /100 | #314 | Tragic 81.5% |
| Immigrants | Mexico | 0.0 /100 | #315 | Tragic 81.5% |
| Comanche | 0.0 /100 | #316 | Tragic 81.5% |
| Cherokee | 0.0 /100 | #317 | Tragic 81.4% |
| Alaskan Athabascans | 0.0 /100 | #318 | Tragic 81.3% |
| Inupiat | 0.0 /100 | #319 | Tragic 80.9% |
| Chickasaw | 0.0 /100 | #320 | Tragic 80.9% |
| Puerto Ricans | 0.0 /100 | #321 | Tragic 80.7% |
| Paiute | 0.0 /100 | #322 | Tragic 80.6% |
| Yaqui | 0.0 /100 | #323 | Tragic 80.5% |
| Choctaw | 0.0 /100 | #324 | Tragic 80.5% |
| Dutch West Indians | 0.0 /100 | #325 | Tragic 80.4% |
Demographics Similar to Slovaks by In Labor Force | Age 35-44
In terms of in labor force | age 35-44, the demographic groups most similar to Slovaks are Serbian (85.1%, a difference of 0.0%), Chinese (85.1%, a difference of 0.010%), Albanian (85.1%, a difference of 0.010%), Immigrants from Croatia (85.1%, a difference of 0.020%), and Immigrants from Latvia (85.0%, a difference of 0.020%).
| Demographics | Rating | Rank | In Labor Force | Age 35-44 |
| Immigrants | Albania | 99.7 /100 | #51 | Exceptional 85.1% |
| Immigrants | Kenya | 99.6 /100 | #52 | Exceptional 85.1% |
| Taiwanese | 99.6 /100 | #53 | Exceptional 85.1% |
| Turks | 99.5 /100 | #54 | Exceptional 85.1% |
| Soviet Union | 99.5 /100 | #55 | Exceptional 85.1% |
| Immigrants | Croatia | 99.5 /100 | #56 | Exceptional 85.1% |
| Chinese | 99.4 /100 | #57 | Exceptional 85.1% |
| Slovaks | 99.4 /100 | #58 | Exceptional 85.1% |
| Serbians | 99.4 /100 | #59 | Exceptional 85.1% |
| Albanians | 99.4 /100 | #60 | Exceptional 85.1% |
| Immigrants | Latvia | 99.3 /100 | #61 | Exceptional 85.0% |
| Immigrants | Moldova | 99.3 /100 | #62 | Exceptional 85.0% |
| Immigrants | Uganda | 99.3 /100 | #63 | Exceptional 85.0% |
| Swedes | 99.2 /100 | #64 | Exceptional 85.0% |
| Immigrants | Brazil | 99.2 /100 | #65 | Exceptional 85.0% |