Alaskan Athabascan vs Cape Verdean In Labor Force | Age 35-44
COMPARE
Alaskan Athabascan
Cape Verdean
In Labor Force | Age 35-44
In Labor Force | Age 35-44 Comparison
Alaskan Athabascans
Cape Verdeans
81.3%
IN LABOR FORCE | AGE 35-44
0.0/ 100
METRIC RATING
318th/ 347
METRIC RANK
85.8%
IN LABOR FORCE | AGE 35-44
100.0/ 100
METRIC RATING
10th/ 347
METRIC RANK
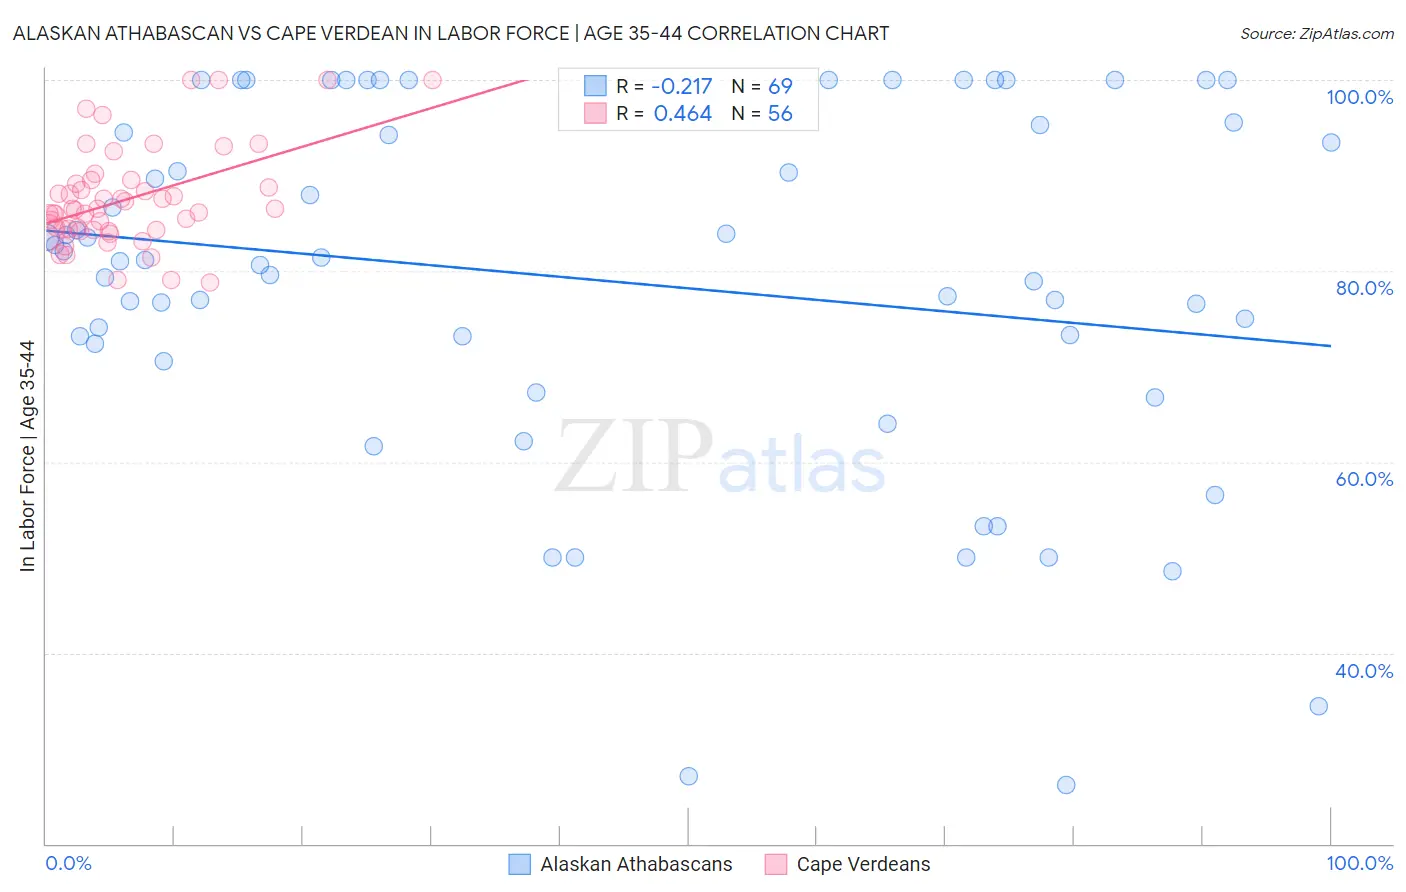
Alaskan Athabascan vs Cape Verdean In Labor Force | Age 35-44 Correlation Chart
The statistical analysis conducted on geographies consisting of 45,819,341 people shows a weak negative correlation between the proportion of Alaskan Athabascans and labor force participation rate among population between the ages 35 and 44 in the United States with a correlation coefficient (R) of -0.217 and weighted average of 81.3%. Similarly, the statistical analysis conducted on geographies consisting of 107,550,182 people shows a moderate positive correlation between the proportion of Cape Verdeans and labor force participation rate among population between the ages 35 and 44 in the United States with a correlation coefficient (R) of 0.464 and weighted average of 85.8%, a difference of 5.5%.
In Labor Force | Age 35-44 Correlation Summary
| Measurement | Alaskan Athabascan | Cape Verdean |
| Minimum | 26.1% | 78.8% |
| Maximum | 100.0% | 100.0% |
| Range | 73.9% | 21.2% |
| Mean | 79.1% | 87.5% |
| Median | 81.2% | 86.5% |
| Interquartile 25% (IQ1) | 71.5% | 84.3% |
| Interquartile 75% (IQ3) | 95.4% | 89.3% |
| Interquartile Range (IQR) | 23.9% | 5.0% |
| Standard Deviation (Sample) | 18.8% | 5.2% |
| Standard Deviation (Population) | 18.6% | 5.2% |
Similar Demographics by In Labor Force | Age 35-44
Demographics Similar to Alaskan Athabascans by In Labor Force | Age 35-44
In terms of in labor force | age 35-44, the demographic groups most similar to Alaskan Athabascans are Cherokee (81.4%, a difference of 0.12%), Comanche (81.5%, a difference of 0.20%), Immigrants from Mexico (81.5%, a difference of 0.22%), Cajun (81.5%, a difference of 0.25%), and Alaska Native (81.6%, a difference of 0.36%).
| Demographics | Rating | Rank | In Labor Force | Age 35-44 |
| Colville | 0.0 /100 | #311 | Tragic 81.7% |
| Alaska Natives | 0.0 /100 | #312 | Tragic 81.6% |
| Mexicans | 0.0 /100 | #313 | Tragic 81.6% |
| Cajuns | 0.0 /100 | #314 | Tragic 81.5% |
| Immigrants | Mexico | 0.0 /100 | #315 | Tragic 81.5% |
| Comanche | 0.0 /100 | #316 | Tragic 81.5% |
| Cherokee | 0.0 /100 | #317 | Tragic 81.4% |
| Alaskan Athabascans | 0.0 /100 | #318 | Tragic 81.3% |
| Inupiat | 0.0 /100 | #319 | Tragic 80.9% |
| Chickasaw | 0.0 /100 | #320 | Tragic 80.9% |
| Puerto Ricans | 0.0 /100 | #321 | Tragic 80.7% |
| Paiute | 0.0 /100 | #322 | Tragic 80.6% |
| Yaqui | 0.0 /100 | #323 | Tragic 80.5% |
| Choctaw | 0.0 /100 | #324 | Tragic 80.5% |
| Dutch West Indians | 0.0 /100 | #325 | Tragic 80.4% |
Demographics Similar to Cape Verdeans by In Labor Force | Age 35-44
In terms of in labor force | age 35-44, the demographic groups most similar to Cape Verdeans are Immigrants from Cameroon (85.8%, a difference of 0.030%), Immigrants from Ethiopia (85.9%, a difference of 0.13%), Ethiopian (85.9%, a difference of 0.13%), Liberian (85.7%, a difference of 0.15%), and Somali (85.6%, a difference of 0.17%).
| Demographics | Rating | Rank | In Labor Force | Age 35-44 |
| Immigrants | Bolivia | 100.0 /100 | #3 | Exceptional 86.2% |
| Immigrants | Cabo Verde | 100.0 /100 | #4 | Exceptional 86.2% |
| Zimbabweans | 100.0 /100 | #5 | Exceptional 86.1% |
| Bolivians | 100.0 /100 | #6 | Exceptional 86.1% |
| Immigrants | Sierra Leone | 100.0 /100 | #7 | Exceptional 86.1% |
| Immigrants | Ethiopia | 100.0 /100 | #8 | Exceptional 85.9% |
| Ethiopians | 100.0 /100 | #9 | Exceptional 85.9% |
| Cape Verdeans | 100.0 /100 | #10 | Exceptional 85.8% |
| Immigrants | Cameroon | 100.0 /100 | #11 | Exceptional 85.8% |
| Liberians | 100.0 /100 | #12 | Exceptional 85.7% |
| Somalis | 100.0 /100 | #13 | Exceptional 85.6% |
| Immigrants | Somalia | 100.0 /100 | #14 | Exceptional 85.6% |
| Norwegians | 100.0 /100 | #15 | Exceptional 85.6% |
| Immigrants | Ireland | 100.0 /100 | #16 | Exceptional 85.6% |
| Immigrants | North Macedonia | 100.0 /100 | #17 | Exceptional 85.6% |