Latvian vs Spanish American In Labor Force | Age 35-44
COMPARE
Latvian
Spanish American
In Labor Force | Age 35-44
In Labor Force | Age 35-44 Comparison
Latvians
Spanish Americans
85.4%
IN LABOR FORCE | AGE 35-44
99.9/ 100
METRIC RATING
24th/ 347
METRIC RANK
82.8%
IN LABOR FORCE | AGE 35-44
0.0/ 100
METRIC RATING
293rd/ 347
METRIC RANK
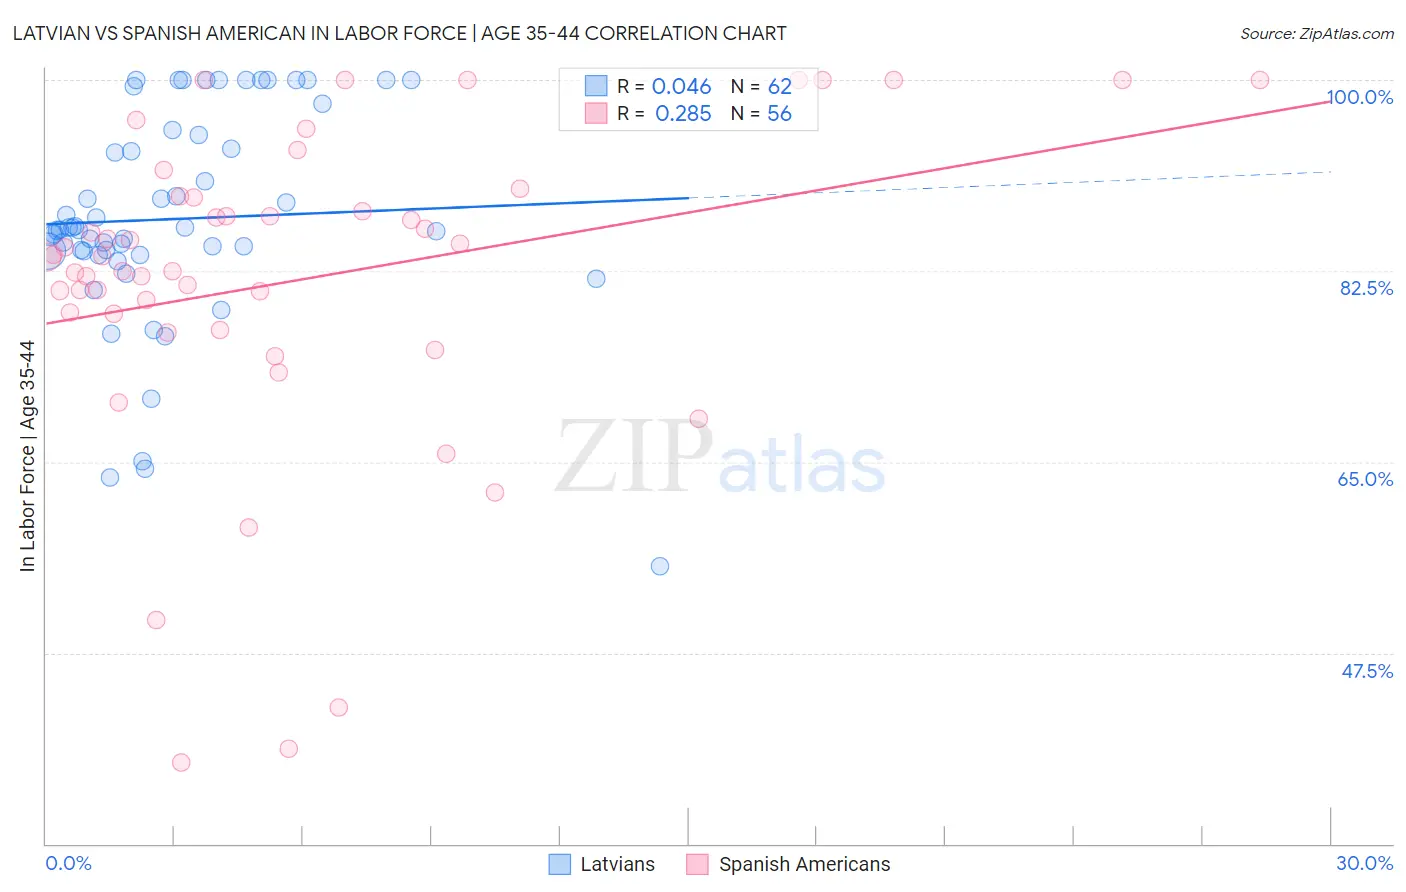
Latvian vs Spanish American In Labor Force | Age 35-44 Correlation Chart
The statistical analysis conducted on geographies consisting of 220,671,100 people shows no correlation between the proportion of Latvians and labor force participation rate among population between the ages 35 and 44 in the United States with a correlation coefficient (R) of 0.046 and weighted average of 85.4%. Similarly, the statistical analysis conducted on geographies consisting of 103,164,815 people shows a weak positive correlation between the proportion of Spanish Americans and labor force participation rate among population between the ages 35 and 44 in the United States with a correlation coefficient (R) of 0.285 and weighted average of 82.8%, a difference of 3.2%.
In Labor Force | Age 35-44 Correlation Summary
| Measurement | Latvian | Spanish American |
| Minimum | 55.4% | 37.5% |
| Maximum | 100.0% | 100.0% |
| Range | 44.6% | 62.5% |
| Mean | 87.3% | 81.7% |
| Median | 86.3% | 83.8% |
| Interquartile 25% (IQ1) | 84.3% | 77.8% |
| Interquartile 75% (IQ3) | 95.0% | 89.2% |
| Interquartile Range (IQR) | 10.7% | 11.4% |
| Standard Deviation (Sample) | 9.9% | 14.6% |
| Standard Deviation (Population) | 9.8% | 14.5% |
Similar Demographics by In Labor Force | Age 35-44
Demographics Similar to Latvians by In Labor Force | Age 35-44
In terms of in labor force | age 35-44, the demographic groups most similar to Latvians are Paraguayan (85.4%, a difference of 0.010%), Immigrants from Liberia (85.4%, a difference of 0.010%), Immigrants from Lithuania (85.4%, a difference of 0.020%), Immigrants from Greece (85.3%, a difference of 0.030%), and Immigrants from Eastern Africa (85.4%, a difference of 0.060%).
| Demographics | Rating | Rank | In Labor Force | Age 35-44 |
| Immigrants | North Macedonia | 100.0 /100 | #17 | Exceptional 85.6% |
| Carpatho Rusyns | 100.0 /100 | #18 | Exceptional 85.6% |
| Slovenes | 100.0 /100 | #19 | Exceptional 85.6% |
| Immigrants | Serbia | 100.0 /100 | #20 | Exceptional 85.5% |
| Bulgarians | 100.0 /100 | #21 | Exceptional 85.5% |
| Immigrants | Bosnia and Herzegovina | 100.0 /100 | #22 | Exceptional 85.4% |
| Immigrants | Eastern Africa | 100.0 /100 | #23 | Exceptional 85.4% |
| Latvians | 99.9 /100 | #24 | Exceptional 85.4% |
| Paraguayans | 99.9 /100 | #25 | Exceptional 85.4% |
| Immigrants | Liberia | 99.9 /100 | #26 | Exceptional 85.4% |
| Immigrants | Lithuania | 99.9 /100 | #27 | Exceptional 85.4% |
| Immigrants | Greece | 99.9 /100 | #28 | Exceptional 85.3% |
| Cambodians | 99.9 /100 | #29 | Exceptional 85.3% |
| Bermudans | 99.9 /100 | #30 | Exceptional 85.3% |
| Czechs | 99.9 /100 | #31 | Exceptional 85.3% |
Demographics Similar to Spanish Americans by In Labor Force | Age 35-44
In terms of in labor force | age 35-44, the demographic groups most similar to Spanish Americans are Potawatomi (82.7%, a difference of 0.080%), Immigrants from Latin America (82.8%, a difference of 0.090%), Immigrants from Lebanon (82.7%, a difference of 0.13%), Pennsylvania German (82.9%, a difference of 0.14%), and African (82.9%, a difference of 0.16%).
| Demographics | Rating | Rank | In Labor Force | Age 35-44 |
| Immigrants | Bangladesh | 0.0 /100 | #286 | Tragic 82.9% |
| Immigrants | Belize | 0.0 /100 | #287 | Tragic 82.9% |
| Puget Sound Salish | 0.0 /100 | #288 | Tragic 82.9% |
| Chippewa | 0.0 /100 | #289 | Tragic 82.9% |
| Africans | 0.0 /100 | #290 | Tragic 82.9% |
| Pennsylvania Germans | 0.0 /100 | #291 | Tragic 82.9% |
| Immigrants | Latin America | 0.0 /100 | #292 | Tragic 82.8% |
| Spanish Americans | 0.0 /100 | #293 | Tragic 82.8% |
| Potawatomi | 0.0 /100 | #294 | Tragic 82.7% |
| Immigrants | Lebanon | 0.0 /100 | #295 | Tragic 82.7% |
| Mexican American Indians | 0.0 /100 | #296 | Tragic 82.6% |
| Hmong | 0.0 /100 | #297 | Tragic 82.6% |
| Ottawa | 0.0 /100 | #298 | Tragic 82.6% |
| Tlingit-Haida | 0.0 /100 | #299 | Tragic 82.5% |
| Central American Indians | 0.0 /100 | #300 | Tragic 82.5% |