Immigrants from Norway vs Spanish American In Labor Force | Age 35-44
COMPARE
Immigrants from Norway
Spanish American
In Labor Force | Age 35-44
In Labor Force | Age 35-44 Comparison
Immigrants from Norway
Spanish Americans
84.1%
IN LABOR FORCE | AGE 35-44
11.7/ 100
METRIC RATING
217th/ 347
METRIC RANK
82.8%
IN LABOR FORCE | AGE 35-44
0.0/ 100
METRIC RATING
293rd/ 347
METRIC RANK
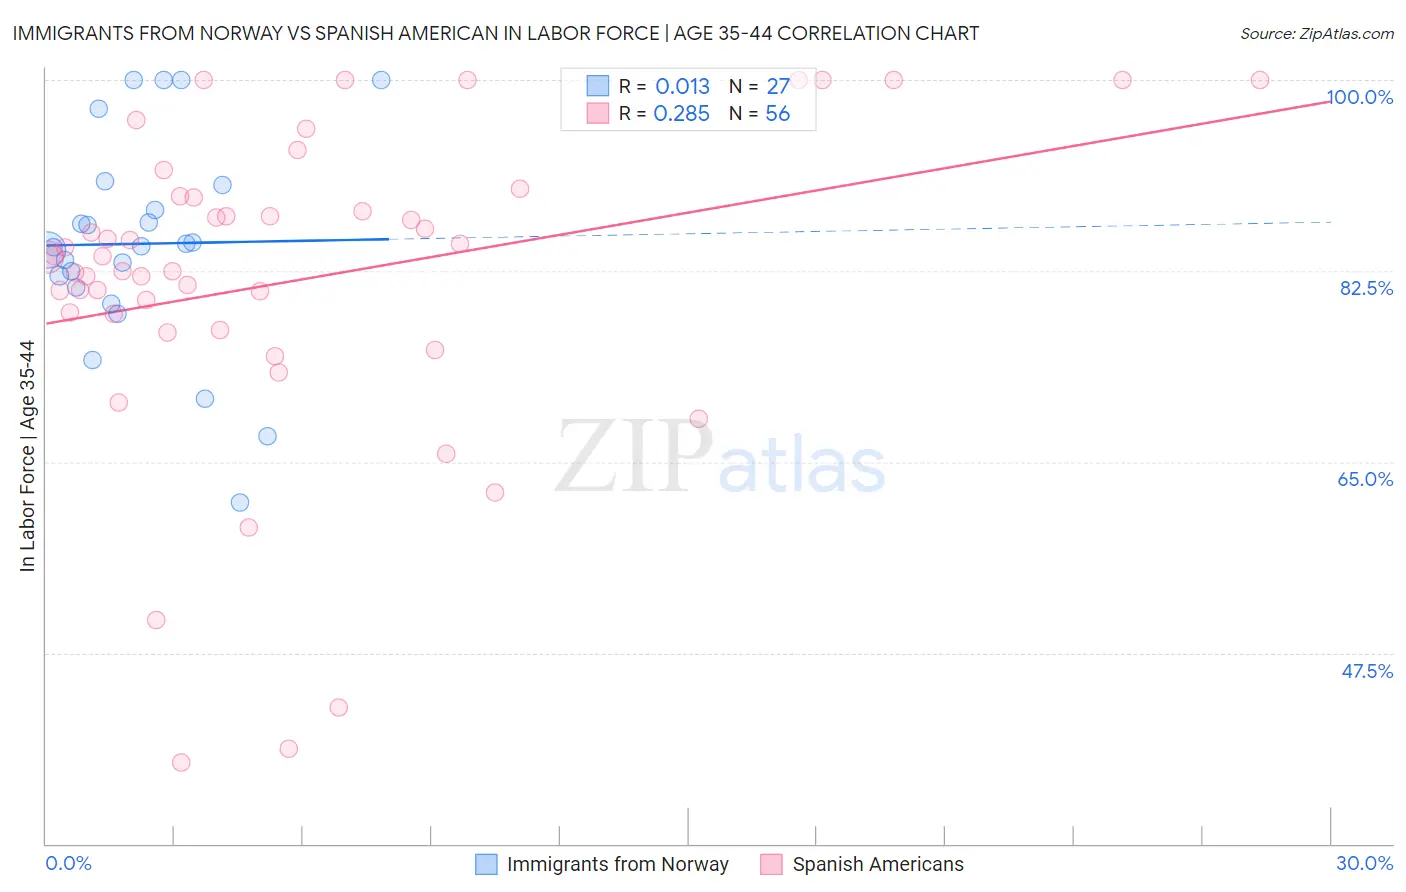
Immigrants from Norway vs Spanish American In Labor Force | Age 35-44 Correlation Chart
The statistical analysis conducted on geographies consisting of 116,704,105 people shows no correlation between the proportion of Immigrants from Norway and labor force participation rate among population between the ages 35 and 44 in the United States with a correlation coefficient (R) of 0.013 and weighted average of 84.1%. Similarly, the statistical analysis conducted on geographies consisting of 103,164,815 people shows a weak positive correlation between the proportion of Spanish Americans and labor force participation rate among population between the ages 35 and 44 in the United States with a correlation coefficient (R) of 0.285 and weighted average of 82.8%, a difference of 1.6%.
In Labor Force | Age 35-44 Correlation Summary
| Measurement | Immigrants from Norway | Spanish American |
| Minimum | 61.3% | 37.5% |
| Maximum | 100.0% | 100.0% |
| Range | 38.7% | 62.5% |
| Mean | 85.0% | 81.7% |
| Median | 84.8% | 83.8% |
| Interquartile 25% (IQ1) | 80.9% | 77.8% |
| Interquartile 75% (IQ3) | 90.4% | 89.2% |
| Interquartile Range (IQR) | 9.5% | 11.4% |
| Standard Deviation (Sample) | 9.7% | 14.6% |
| Standard Deviation (Population) | 9.5% | 14.5% |
Similar Demographics by In Labor Force | Age 35-44
Demographics Similar to Immigrants from Norway by In Labor Force | Age 35-44
In terms of in labor force | age 35-44, the demographic groups most similar to Immigrants from Norway are European (84.1%, a difference of 0.010%), Nicaraguan (84.1%, a difference of 0.010%), Immigrants from Barbados (84.1%, a difference of 0.020%), Israeli (84.1%, a difference of 0.030%), and Bangladeshi (84.1%, a difference of 0.030%).
| Demographics | Rating | Rank | In Labor Force | Age 35-44 |
| New Zealanders | 16.2 /100 | #210 | Poor 84.1% |
| Immigrants | Ecuador | 15.2 /100 | #211 | Poor 84.1% |
| Israelis | 14.0 /100 | #212 | Poor 84.1% |
| Bangladeshis | 13.7 /100 | #213 | Poor 84.1% |
| Immigrants | Barbados | 13.2 /100 | #214 | Poor 84.1% |
| Europeans | 12.2 /100 | #215 | Poor 84.1% |
| Nicaraguans | 12.1 /100 | #216 | Poor 84.1% |
| Immigrants | Norway | 11.7 /100 | #217 | Poor 84.1% |
| Immigrants | Nicaragua | 9.4 /100 | #218 | Tragic 84.1% |
| Sub-Saharan Africans | 9.3 /100 | #219 | Tragic 84.1% |
| French | 7.5 /100 | #220 | Tragic 84.0% |
| Icelanders | 6.7 /100 | #221 | Tragic 84.0% |
| Assyrians/Chaldeans/Syriacs | 6.6 /100 | #222 | Tragic 84.0% |
| Immigrants | Panama | 6.4 /100 | #223 | Tragic 84.0% |
| U.S. Virgin Islanders | 6.1 /100 | #224 | Tragic 84.0% |
Demographics Similar to Spanish Americans by In Labor Force | Age 35-44
In terms of in labor force | age 35-44, the demographic groups most similar to Spanish Americans are Potawatomi (82.7%, a difference of 0.080%), Immigrants from Latin America (82.8%, a difference of 0.090%), Immigrants from Lebanon (82.7%, a difference of 0.13%), Pennsylvania German (82.9%, a difference of 0.14%), and African (82.9%, a difference of 0.16%).
| Demographics | Rating | Rank | In Labor Force | Age 35-44 |
| Immigrants | Bangladesh | 0.0 /100 | #286 | Tragic 82.9% |
| Immigrants | Belize | 0.0 /100 | #287 | Tragic 82.9% |
| Puget Sound Salish | 0.0 /100 | #288 | Tragic 82.9% |
| Chippewa | 0.0 /100 | #289 | Tragic 82.9% |
| Africans | 0.0 /100 | #290 | Tragic 82.9% |
| Pennsylvania Germans | 0.0 /100 | #291 | Tragic 82.9% |
| Immigrants | Latin America | 0.0 /100 | #292 | Tragic 82.8% |
| Spanish Americans | 0.0 /100 | #293 | Tragic 82.8% |
| Potawatomi | 0.0 /100 | #294 | Tragic 82.7% |
| Immigrants | Lebanon | 0.0 /100 | #295 | Tragic 82.7% |
| Mexican American Indians | 0.0 /100 | #296 | Tragic 82.6% |
| Hmong | 0.0 /100 | #297 | Tragic 82.6% |
| Ottawa | 0.0 /100 | #298 | Tragic 82.6% |
| Tlingit-Haida | 0.0 /100 | #299 | Tragic 82.5% |
| Central American Indians | 0.0 /100 | #300 | Tragic 82.5% |