Alaskan Athabascan vs Spanish American Unemployment Among Seniors over 75 years
COMPARE
Alaskan Athabascan
Spanish American
Unemployment Among Seniors over 75 years
Unemployment Among Seniors over 75 years Comparison
Alaskan Athabascans
Spanish Americans
11.0%
UNEMPLOYMENT AMONG SENIORS OVER 75 YEARS
0.0/ 100
METRIC RATING
333rd/ 347
METRIC RANK
8.0%
UNEMPLOYMENT AMONG SENIORS OVER 75 YEARS
99.8/ 100
METRIC RATING
74th/ 347
METRIC RANK
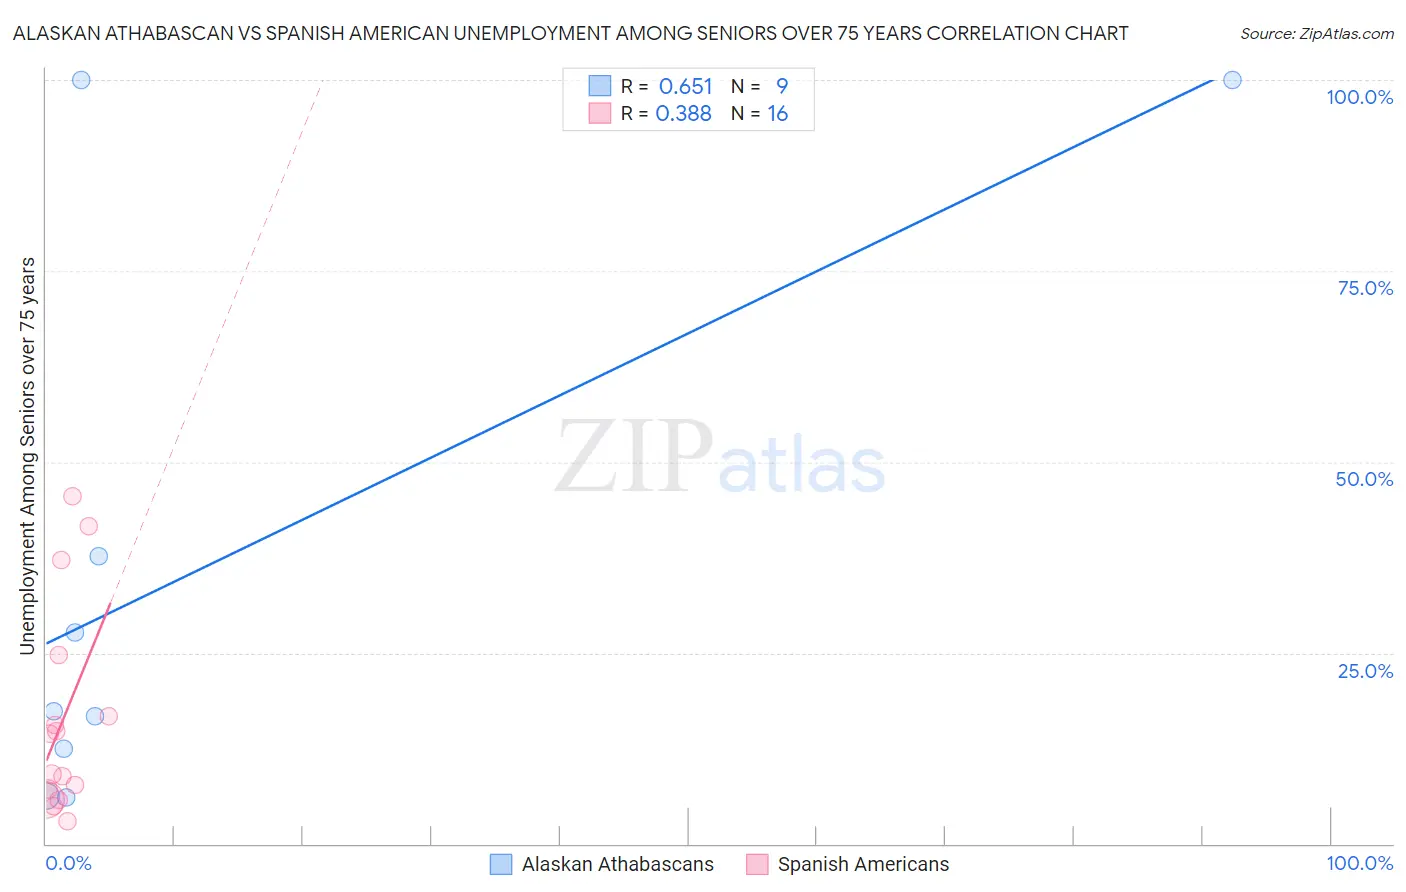
Alaskan Athabascan vs Spanish American Unemployment Among Seniors over 75 years Correlation Chart
The statistical analysis conducted on geographies consisting of 36,036,247 people shows a significant positive correlation between the proportion of Alaskan Athabascans and unemployment rate among seniors over the age of 75 in the United States with a correlation coefficient (R) of 0.651 and weighted average of 11.0%. Similarly, the statistical analysis conducted on geographies consisting of 78,121,441 people shows a mild positive correlation between the proportion of Spanish Americans and unemployment rate among seniors over the age of 75 in the United States with a correlation coefficient (R) of 0.388 and weighted average of 8.0%, a difference of 37.9%.
Unemployment Among Seniors over 75 years Correlation Summary
| Measurement | Alaskan Athabascan | Spanish American |
| Minimum | 6.0% | 3.0% |
| Maximum | 100.0% | 45.5% |
| Range | 94.0% | 42.5% |
| Mean | 36.0% | 16.4% |
| Median | 17.3% | 11.8% |
| Interquartile 25% (IQ1) | 9.4% | 6.5% |
| Interquartile 75% (IQ3) | 68.8% | 20.7% |
| Interquartile Range (IQR) | 59.5% | 14.2% |
| Standard Deviation (Sample) | 37.6% | 13.7% |
| Standard Deviation (Population) | 35.5% | 13.2% |
Similar Demographics by Unemployment Among Seniors over 75 years
Demographics Similar to Alaskan Athabascans by Unemployment Among Seniors over 75 years
In terms of unemployment among seniors over 75 years, the demographic groups most similar to Alaskan Athabascans are Assyrian/Chaldean/Syriac (11.1%, a difference of 0.35%), Immigrants from Liberia (10.9%, a difference of 1.2%), French Canadian (11.2%, a difference of 1.5%), Tohono O'odham (10.8%, a difference of 1.9%), and Immigrants from North Macedonia (11.3%, a difference of 2.7%).
| Demographics | Rating | Rank | Unemployment Among Seniors over 75 years |
| Slovaks | 0.0 /100 | #326 | Tragic 10.4% |
| Dutch | 0.0 /100 | #327 | Tragic 10.4% |
| Immigrants | Portugal | 0.0 /100 | #328 | Tragic 10.5% |
| Tsimshian | 0.0 /100 | #329 | Tragic 10.5% |
| Immigrants | Azores | 0.0 /100 | #330 | Tragic 10.7% |
| Tohono O'odham | 0.0 /100 | #331 | Tragic 10.8% |
| Immigrants | Liberia | 0.0 /100 | #332 | Tragic 10.9% |
| Alaskan Athabascans | 0.0 /100 | #333 | Tragic 11.0% |
| Assyrians/Chaldeans/Syriacs | 0.0 /100 | #334 | Tragic 11.1% |
| French Canadians | 0.0 /100 | #335 | Tragic 11.2% |
| Immigrants | North Macedonia | 0.0 /100 | #336 | Tragic 11.3% |
| Cape Verdeans | 0.0 /100 | #337 | Tragic 11.4% |
| Immigrants | Cabo Verde | 0.0 /100 | #338 | Tragic 12.3% |
| Cajuns | 0.0 /100 | #339 | Tragic 12.5% |
| Yup'ik | 0.0 /100 | #340 | Tragic 12.8% |
Demographics Similar to Spanish Americans by Unemployment Among Seniors over 75 years
In terms of unemployment among seniors over 75 years, the demographic groups most similar to Spanish Americans are Immigrants from France (8.0%, a difference of 0.040%), Bolivian (8.0%, a difference of 0.090%), Immigrants from Cambodia (8.0%, a difference of 0.13%), Immigrants from Argentina (8.0%, a difference of 0.20%), and Indian (Asian) (8.0%, a difference of 0.27%).
| Demographics | Rating | Rank | Unemployment Among Seniors over 75 years |
| Immigrants | Syria | 99.9 /100 | #67 | Exceptional 8.0% |
| Immigrants | South Africa | 99.9 /100 | #68 | Exceptional 8.0% |
| Indians (Asian) | 99.9 /100 | #69 | Exceptional 8.0% |
| Immigrants | Argentina | 99.9 /100 | #70 | Exceptional 8.0% |
| Immigrants | Cambodia | 99.9 /100 | #71 | Exceptional 8.0% |
| Bolivians | 99.9 /100 | #72 | Exceptional 8.0% |
| Immigrants | France | 99.9 /100 | #73 | Exceptional 8.0% |
| Spanish Americans | 99.8 /100 | #74 | Exceptional 8.0% |
| Immigrants | Uganda | 99.8 /100 | #75 | Exceptional 8.0% |
| Immigrants | Venezuela | 99.8 /100 | #76 | Exceptional 8.0% |
| Immigrants | Turkey | 99.8 /100 | #77 | Exceptional 8.0% |
| Immigrants | Belarus | 99.8 /100 | #78 | Exceptional 8.0% |
| Immigrants | Japan | 99.7 /100 | #79 | Exceptional 8.0% |
| Immigrants | Australia | 99.7 /100 | #80 | Exceptional 8.0% |
| Cubans | 99.7 /100 | #81 | Exceptional 8.0% |