Alaskan Athabascan vs Estonian In Labor Force | Age 35-44
COMPARE
Alaskan Athabascan
Estonian
In Labor Force | Age 35-44
In Labor Force | Age 35-44 Comparison
Alaskan Athabascans
Estonians
81.3%
IN LABOR FORCE | AGE 35-44
0.0/ 100
METRIC RATING
318th/ 347
METRIC RANK
85.3%
IN LABOR FORCE | AGE 35-44
99.9/ 100
METRIC RATING
35th/ 347
METRIC RANK
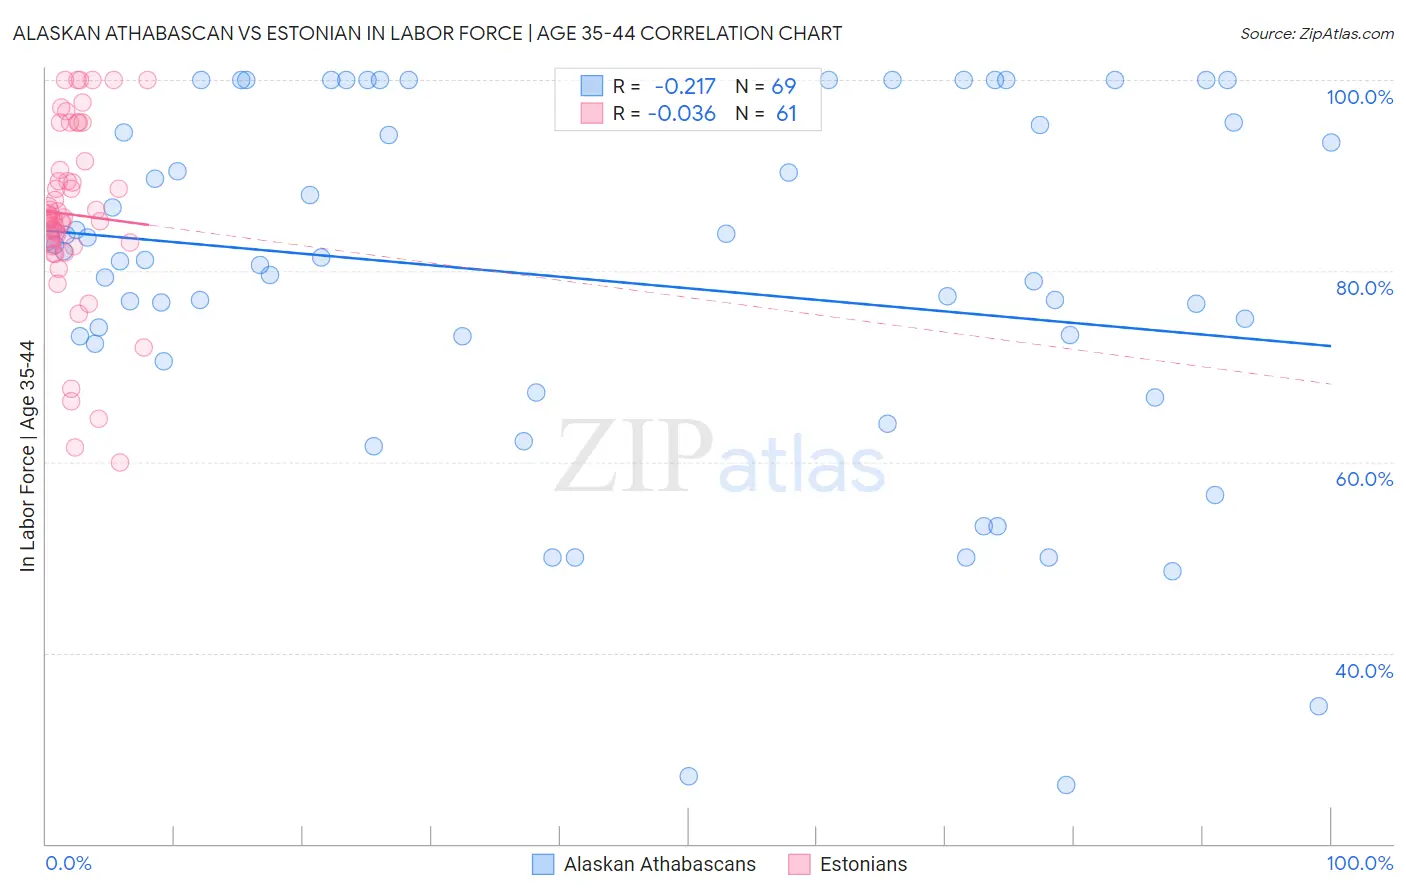
Alaskan Athabascan vs Estonian In Labor Force | Age 35-44 Correlation Chart
The statistical analysis conducted on geographies consisting of 45,819,341 people shows a weak negative correlation between the proportion of Alaskan Athabascans and labor force participation rate among population between the ages 35 and 44 in the United States with a correlation coefficient (R) of -0.217 and weighted average of 81.3%. Similarly, the statistical analysis conducted on geographies consisting of 123,503,374 people shows no correlation between the proportion of Estonians and labor force participation rate among population between the ages 35 and 44 in the United States with a correlation coefficient (R) of -0.036 and weighted average of 85.3%, a difference of 4.9%.
In Labor Force | Age 35-44 Correlation Summary
| Measurement | Alaskan Athabascan | Estonian |
| Minimum | 26.1% | 60.0% |
| Maximum | 100.0% | 100.0% |
| Range | 73.9% | 40.0% |
| Mean | 79.1% | 85.9% |
| Median | 81.2% | 85.5% |
| Interquartile 25% (IQ1) | 71.5% | 82.7% |
| Interquartile 75% (IQ3) | 95.4% | 91.1% |
| Interquartile Range (IQR) | 23.9% | 8.3% |
| Standard Deviation (Sample) | 18.8% | 9.3% |
| Standard Deviation (Population) | 18.6% | 9.2% |
Similar Demographics by In Labor Force | Age 35-44
Demographics Similar to Alaskan Athabascans by In Labor Force | Age 35-44
In terms of in labor force | age 35-44, the demographic groups most similar to Alaskan Athabascans are Cherokee (81.4%, a difference of 0.12%), Comanche (81.5%, a difference of 0.20%), Immigrants from Mexico (81.5%, a difference of 0.22%), Cajun (81.5%, a difference of 0.25%), and Alaska Native (81.6%, a difference of 0.36%).
| Demographics | Rating | Rank | In Labor Force | Age 35-44 |
| Colville | 0.0 /100 | #311 | Tragic 81.7% |
| Alaska Natives | 0.0 /100 | #312 | Tragic 81.6% |
| Mexicans | 0.0 /100 | #313 | Tragic 81.6% |
| Cajuns | 0.0 /100 | #314 | Tragic 81.5% |
| Immigrants | Mexico | 0.0 /100 | #315 | Tragic 81.5% |
| Comanche | 0.0 /100 | #316 | Tragic 81.5% |
| Cherokee | 0.0 /100 | #317 | Tragic 81.4% |
| Alaskan Athabascans | 0.0 /100 | #318 | Tragic 81.3% |
| Inupiat | 0.0 /100 | #319 | Tragic 80.9% |
| Chickasaw | 0.0 /100 | #320 | Tragic 80.9% |
| Puerto Ricans | 0.0 /100 | #321 | Tragic 80.7% |
| Paiute | 0.0 /100 | #322 | Tragic 80.6% |
| Yaqui | 0.0 /100 | #323 | Tragic 80.5% |
| Choctaw | 0.0 /100 | #324 | Tragic 80.5% |
| Dutch West Indians | 0.0 /100 | #325 | Tragic 80.4% |
Demographics Similar to Estonians by In Labor Force | Age 35-44
In terms of in labor force | age 35-44, the demographic groups most similar to Estonians are Immigrants from Nepal (85.3%, a difference of 0.0%), Ugandan (85.3%, a difference of 0.030%), Immigrants from Morocco (85.2%, a difference of 0.030%), Bermudan (85.3%, a difference of 0.040%), and Czech (85.3%, a difference of 0.040%).
| Demographics | Rating | Rank | In Labor Force | Age 35-44 |
| Immigrants | Greece | 99.9 /100 | #28 | Exceptional 85.3% |
| Cambodians | 99.9 /100 | #29 | Exceptional 85.3% |
| Bermudans | 99.9 /100 | #30 | Exceptional 85.3% |
| Czechs | 99.9 /100 | #31 | Exceptional 85.3% |
| Immigrants | India | 99.9 /100 | #32 | Exceptional 85.3% |
| Ugandans | 99.9 /100 | #33 | Exceptional 85.3% |
| Immigrants | Nepal | 99.9 /100 | #34 | Exceptional 85.3% |
| Estonians | 99.9 /100 | #35 | Exceptional 85.3% |
| Immigrants | Morocco | 99.8 /100 | #36 | Exceptional 85.2% |
| Kenyans | 99.8 /100 | #37 | Exceptional 85.2% |
| Immigrants | Poland | 99.8 /100 | #38 | Exceptional 85.2% |
| Eastern Europeans | 99.8 /100 | #39 | Exceptional 85.2% |
| Immigrants | Bulgaria | 99.8 /100 | #40 | Exceptional 85.2% |
| Immigrants | Zimbabwe | 99.8 /100 | #41 | Exceptional 85.2% |
| Macedonians | 99.8 /100 | #42 | Exceptional 85.2% |