Alaskan Athabascan vs Immigrants from Greece In Labor Force | Age 35-44
COMPARE
Alaskan Athabascan
Immigrants from Greece
In Labor Force | Age 35-44
In Labor Force | Age 35-44 Comparison
Alaskan Athabascans
Immigrants from Greece
81.3%
IN LABOR FORCE | AGE 35-44
0.0/ 100
METRIC RATING
318th/ 347
METRIC RANK
85.3%
IN LABOR FORCE | AGE 35-44
99.9/ 100
METRIC RATING
28th/ 347
METRIC RANK
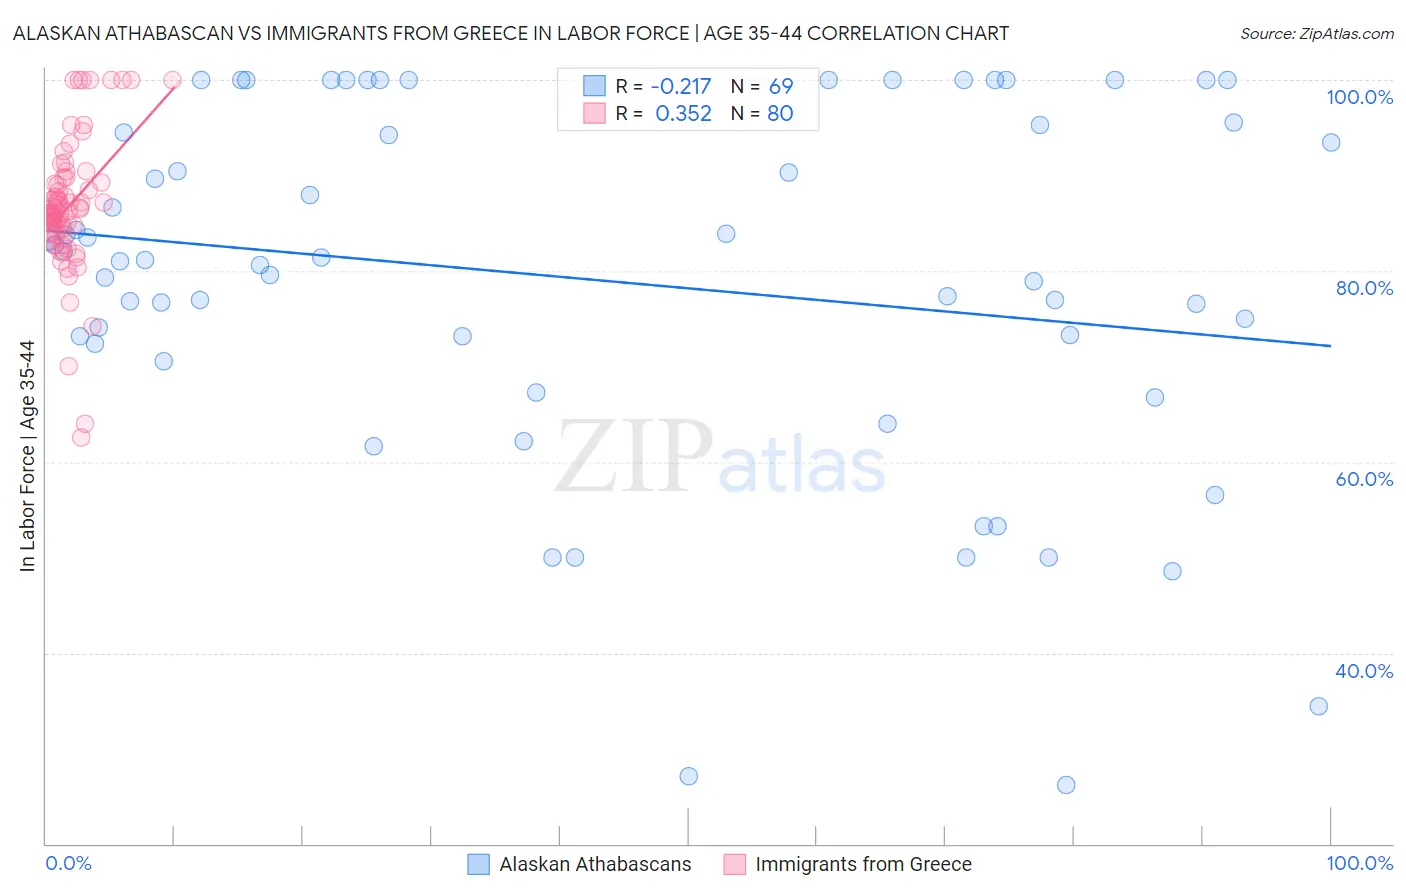
Alaskan Athabascan vs Immigrants from Greece In Labor Force | Age 35-44 Correlation Chart
The statistical analysis conducted on geographies consisting of 45,819,341 people shows a weak negative correlation between the proportion of Alaskan Athabascans and labor force participation rate among population between the ages 35 and 44 in the United States with a correlation coefficient (R) of -0.217 and weighted average of 81.3%. Similarly, the statistical analysis conducted on geographies consisting of 216,859,969 people shows a mild positive correlation between the proportion of Immigrants from Greece and labor force participation rate among population between the ages 35 and 44 in the United States with a correlation coefficient (R) of 0.352 and weighted average of 85.3%, a difference of 5.0%.
In Labor Force | Age 35-44 Correlation Summary
| Measurement | Alaskan Athabascan | Immigrants from Greece |
| Minimum | 26.1% | 62.5% |
| Maximum | 100.0% | 100.0% |
| Range | 73.9% | 37.5% |
| Mean | 79.1% | 86.7% |
| Median | 81.2% | 86.2% |
| Interquartile 25% (IQ1) | 71.5% | 84.2% |
| Interquartile 75% (IQ3) | 95.4% | 89.2% |
| Interquartile Range (IQR) | 23.9% | 4.9% |
| Standard Deviation (Sample) | 18.8% | 7.0% |
| Standard Deviation (Population) | 18.6% | 6.9% |
Similar Demographics by In Labor Force | Age 35-44
Demographics Similar to Alaskan Athabascans by In Labor Force | Age 35-44
In terms of in labor force | age 35-44, the demographic groups most similar to Alaskan Athabascans are Cherokee (81.4%, a difference of 0.12%), Comanche (81.5%, a difference of 0.20%), Immigrants from Mexico (81.5%, a difference of 0.22%), Cajun (81.5%, a difference of 0.25%), and Alaska Native (81.6%, a difference of 0.36%).
| Demographics | Rating | Rank | In Labor Force | Age 35-44 |
| Colville | 0.0 /100 | #311 | Tragic 81.7% |
| Alaska Natives | 0.0 /100 | #312 | Tragic 81.6% |
| Mexicans | 0.0 /100 | #313 | Tragic 81.6% |
| Cajuns | 0.0 /100 | #314 | Tragic 81.5% |
| Immigrants | Mexico | 0.0 /100 | #315 | Tragic 81.5% |
| Comanche | 0.0 /100 | #316 | Tragic 81.5% |
| Cherokee | 0.0 /100 | #317 | Tragic 81.4% |
| Alaskan Athabascans | 0.0 /100 | #318 | Tragic 81.3% |
| Inupiat | 0.0 /100 | #319 | Tragic 80.9% |
| Chickasaw | 0.0 /100 | #320 | Tragic 80.9% |
| Puerto Ricans | 0.0 /100 | #321 | Tragic 80.7% |
| Paiute | 0.0 /100 | #322 | Tragic 80.6% |
| Yaqui | 0.0 /100 | #323 | Tragic 80.5% |
| Choctaw | 0.0 /100 | #324 | Tragic 80.5% |
| Dutch West Indians | 0.0 /100 | #325 | Tragic 80.4% |
Demographics Similar to Immigrants from Greece by In Labor Force | Age 35-44
In terms of in labor force | age 35-44, the demographic groups most similar to Immigrants from Greece are Immigrants from Lithuania (85.4%, a difference of 0.010%), Paraguayan (85.4%, a difference of 0.020%), Immigrants from Liberia (85.4%, a difference of 0.020%), Latvian (85.4%, a difference of 0.030%), and Cambodian (85.3%, a difference of 0.040%).
| Demographics | Rating | Rank | In Labor Force | Age 35-44 |
| Bulgarians | 100.0 /100 | #21 | Exceptional 85.5% |
| Immigrants | Bosnia and Herzegovina | 100.0 /100 | #22 | Exceptional 85.4% |
| Immigrants | Eastern Africa | 100.0 /100 | #23 | Exceptional 85.4% |
| Latvians | 99.9 /100 | #24 | Exceptional 85.4% |
| Paraguayans | 99.9 /100 | #25 | Exceptional 85.4% |
| Immigrants | Liberia | 99.9 /100 | #26 | Exceptional 85.4% |
| Immigrants | Lithuania | 99.9 /100 | #27 | Exceptional 85.4% |
| Immigrants | Greece | 99.9 /100 | #28 | Exceptional 85.3% |
| Cambodians | 99.9 /100 | #29 | Exceptional 85.3% |
| Bermudans | 99.9 /100 | #30 | Exceptional 85.3% |
| Czechs | 99.9 /100 | #31 | Exceptional 85.3% |
| Immigrants | India | 99.9 /100 | #32 | Exceptional 85.3% |
| Ugandans | 99.9 /100 | #33 | Exceptional 85.3% |
| Immigrants | Nepal | 99.9 /100 | #34 | Exceptional 85.3% |
| Estonians | 99.9 /100 | #35 | Exceptional 85.3% |