Alaskan Athabascan vs Immigrants from Greece Unemployment Among Ages 65 to 74 years
COMPARE
Alaskan Athabascan
Immigrants from Greece
Unemployment Among Ages 65 to 74 years
Unemployment Among Ages 65 to 74 years Comparison
Alaskan Athabascans
Immigrants from Greece
7.4%
UNEMPLOYMENT AMONG AGES 65 TO 74 YEARS
0.0/ 100
METRIC RATING
343rd/ 347
METRIC RANK
5.6%
UNEMPLOYMENT AMONG AGES 65 TO 74 YEARS
0.9/ 100
METRIC RATING
245th/ 347
METRIC RANK
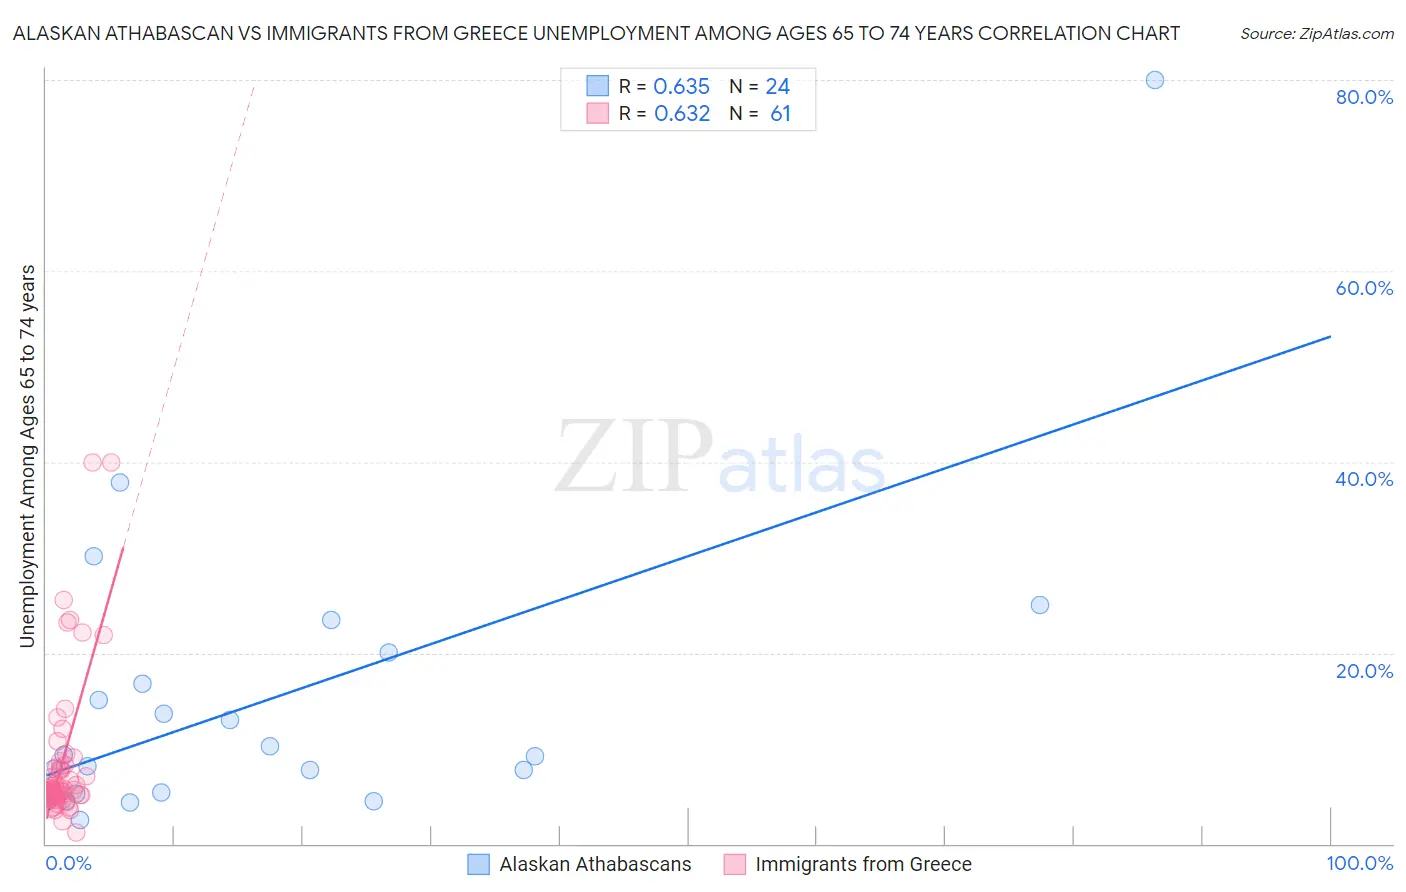
Alaskan Athabascan vs Immigrants from Greece Unemployment Among Ages 65 to 74 years Correlation Chart
The statistical analysis conducted on geographies consisting of 43,758,538 people shows a significant positive correlation between the proportion of Alaskan Athabascans and unemployment rate among population between the ages 65 and 74 in the United States with a correlation coefficient (R) of 0.635 and weighted average of 7.4%. Similarly, the statistical analysis conducted on geographies consisting of 203,377,049 people shows a significant positive correlation between the proportion of Immigrants from Greece and unemployment rate among population between the ages 65 and 74 in the United States with a correlation coefficient (R) of 0.632 and weighted average of 5.6%, a difference of 31.9%.
Unemployment Among Ages 65 to 74 years Correlation Summary
| Measurement | Alaskan Athabascan | Immigrants from Greece |
| Minimum | 2.5% | 1.2% |
| Maximum | 80.0% | 40.0% |
| Range | 77.5% | 38.8% |
| Mean | 15.3% | 8.6% |
| Median | 9.2% | 5.6% |
| Interquartile 25% (IQ1) | 5.3% | 5.0% |
| Interquartile 75% (IQ3) | 18.4% | 8.1% |
| Interquartile Range (IQR) | 13.0% | 3.1% |
| Standard Deviation (Sample) | 16.5% | 7.9% |
| Standard Deviation (Population) | 16.1% | 7.8% |
Similar Demographics by Unemployment Among Ages 65 to 74 years
Demographics Similar to Alaskan Athabascans by Unemployment Among Ages 65 to 74 years
In terms of unemployment among ages 65 to 74 years, the demographic groups most similar to Alaskan Athabascans are Inupiat (7.5%, a difference of 1.9%), Navajo (6.9%, a difference of 6.2%), Alaska Native (6.8%, a difference of 7.7%), Pima (6.6%, a difference of 11.2%), and Yakama (6.6%, a difference of 12.1%).
| Demographics | Rating | Rank | Unemployment Among Ages 65 to 74 years |
| Paiute | 0.0 /100 | #333 | Tragic 6.3% |
| Taiwanese | 0.0 /100 | #334 | Tragic 6.3% |
| Puerto Ricans | 0.0 /100 | #335 | Tragic 6.4% |
| Immigrants | Armenia | 0.0 /100 | #336 | Tragic 6.5% |
| Ute | 0.0 /100 | #337 | Tragic 6.5% |
| Tlingit-Haida | 0.0 /100 | #338 | Tragic 6.5% |
| Yakama | 0.0 /100 | #339 | Tragic 6.6% |
| Pima | 0.0 /100 | #340 | Tragic 6.6% |
| Alaska Natives | 0.0 /100 | #341 | Tragic 6.8% |
| Navajo | 0.0 /100 | #342 | Tragic 6.9% |
| Alaskan Athabascans | 0.0 /100 | #343 | Tragic 7.4% |
| Inupiat | 0.0 /100 | #344 | Tragic 7.5% |
| Immigrants | Yemen | 0.0 /100 | #345 | Tragic 8.3% |
| Yup'ik | 0.0 /100 | #346 | Tragic 9.5% |
| Crow | 0.0 /100 | #347 | Tragic 17.4% |
Demographics Similar to Immigrants from Greece by Unemployment Among Ages 65 to 74 years
In terms of unemployment among ages 65 to 74 years, the demographic groups most similar to Immigrants from Greece are Immigrants from Micronesia (5.6%, a difference of 0.0%), Paraguayan (5.6%, a difference of 0.010%), Immigrants (5.6%, a difference of 0.060%), Immigrants from Argentina (5.6%, a difference of 0.060%), and Trinidadian and Tobagonian (5.6%, a difference of 0.12%).
| Demographics | Rating | Rank | Unemployment Among Ages 65 to 74 years |
| Cajuns | 1.8 /100 | #238 | Tragic 5.5% |
| German Russians | 1.6 /100 | #239 | Tragic 5.5% |
| Ghanaians | 1.4 /100 | #240 | Tragic 5.6% |
| Cree | 1.4 /100 | #241 | Tragic 5.6% |
| Immigrants | Ghana | 1.4 /100 | #242 | Tragic 5.6% |
| Immigrants | Peru | 1.3 /100 | #243 | Tragic 5.6% |
| Immigrants | Micronesia | 0.9 /100 | #244 | Tragic 5.6% |
| Immigrants | Greece | 0.9 /100 | #245 | Tragic 5.6% |
| Paraguayans | 0.9 /100 | #246 | Tragic 5.6% |
| Immigrants | Immigrants | 0.9 /100 | #247 | Tragic 5.6% |
| Immigrants | Argentina | 0.9 /100 | #248 | Tragic 5.6% |
| Trinidadians and Tobagonians | 0.8 /100 | #249 | Tragic 5.6% |
| Cape Verdeans | 0.7 /100 | #250 | Tragic 5.6% |
| Brazilians | 0.5 /100 | #251 | Tragic 5.6% |
| Colombians | 0.5 /100 | #252 | Tragic 5.6% |