Cypriot vs Immigrants from Greece In Labor Force | Age 35-44
COMPARE
Cypriot
Immigrants from Greece
In Labor Force | Age 35-44
In Labor Force | Age 35-44 Comparison
Cypriots
Immigrants from Greece
85.2%
IN LABOR FORCE | AGE 35-44
99.8/ 100
METRIC RATING
45th/ 347
METRIC RANK
85.3%
IN LABOR FORCE | AGE 35-44
99.9/ 100
METRIC RATING
28th/ 347
METRIC RANK
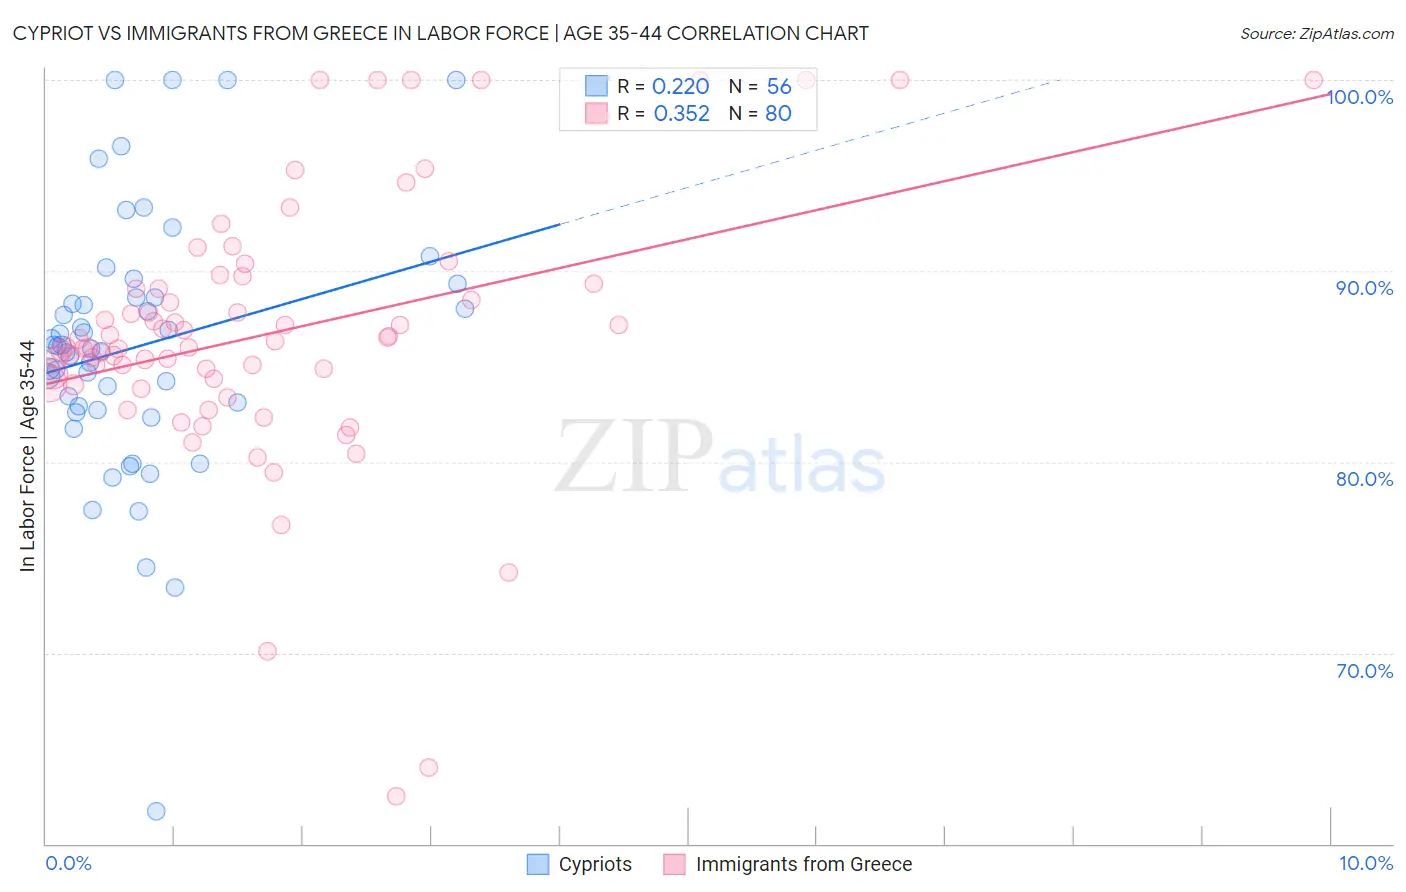
Cypriot vs Immigrants from Greece In Labor Force | Age 35-44 Correlation Chart
The statistical analysis conducted on geographies consisting of 61,851,506 people shows a weak positive correlation between the proportion of Cypriots and labor force participation rate among population between the ages 35 and 44 in the United States with a correlation coefficient (R) of 0.220 and weighted average of 85.2%. Similarly, the statistical analysis conducted on geographies consisting of 216,859,969 people shows a mild positive correlation between the proportion of Immigrants from Greece and labor force participation rate among population between the ages 35 and 44 in the United States with a correlation coefficient (R) of 0.352 and weighted average of 85.3%, a difference of 0.17%.
In Labor Force | Age 35-44 Correlation Summary
| Measurement | Cypriot | Immigrants from Greece |
| Minimum | 61.7% | 62.5% |
| Maximum | 100.0% | 100.0% |
| Range | 38.3% | 37.5% |
| Mean | 86.0% | 86.7% |
| Median | 86.0% | 86.2% |
| Interquartile 25% (IQ1) | 82.8% | 84.2% |
| Interquartile 75% (IQ3) | 88.6% | 89.2% |
| Interquartile Range (IQR) | 5.8% | 4.9% |
| Standard Deviation (Sample) | 6.8% | 7.0% |
| Standard Deviation (Population) | 6.8% | 6.9% |
Demographics Similar to Cypriots and Immigrants from Greece by In Labor Force | Age 35-44
In terms of in labor force | age 35-44, the demographic groups most similar to Cypriots are Immigrants from Hong Kong (85.2%, a difference of 0.0%), Lithuanian (85.2%, a difference of 0.010%), Immigrants from Zimbabwe (85.2%, a difference of 0.020%), Macedonian (85.2%, a difference of 0.020%), and Polish (85.2%, a difference of 0.020%). Similarly, the demographic groups most similar to Immigrants from Greece are Immigrants from Lithuania (85.4%, a difference of 0.010%), Immigrants from Liberia (85.4%, a difference of 0.020%), Cambodian (85.3%, a difference of 0.040%), Bermudan (85.3%, a difference of 0.050%), and Czech (85.3%, a difference of 0.060%).
| Demographics | Rating | Rank | In Labor Force | Age 35-44 |
| Immigrants | Liberia | 99.9 /100 | #26 | Exceptional 85.4% |
| Immigrants | Lithuania | 99.9 /100 | #27 | Exceptional 85.4% |
| Immigrants | Greece | 99.9 /100 | #28 | Exceptional 85.3% |
| Cambodians | 99.9 /100 | #29 | Exceptional 85.3% |
| Bermudans | 99.9 /100 | #30 | Exceptional 85.3% |
| Czechs | 99.9 /100 | #31 | Exceptional 85.3% |
| Immigrants | India | 99.9 /100 | #32 | Exceptional 85.3% |
| Ugandans | 99.9 /100 | #33 | Exceptional 85.3% |
| Immigrants | Nepal | 99.9 /100 | #34 | Exceptional 85.3% |
| Estonians | 99.9 /100 | #35 | Exceptional 85.3% |
| Immigrants | Morocco | 99.8 /100 | #36 | Exceptional 85.2% |
| Kenyans | 99.8 /100 | #37 | Exceptional 85.2% |
| Immigrants | Poland | 99.8 /100 | #38 | Exceptional 85.2% |
| Eastern Europeans | 99.8 /100 | #39 | Exceptional 85.2% |
| Immigrants | Bulgaria | 99.8 /100 | #40 | Exceptional 85.2% |
| Immigrants | Zimbabwe | 99.8 /100 | #41 | Exceptional 85.2% |
| Macedonians | 99.8 /100 | #42 | Exceptional 85.2% |
| Poles | 99.8 /100 | #43 | Exceptional 85.2% |
| Lithuanians | 99.8 /100 | #44 | Exceptional 85.2% |
| Cypriots | 99.8 /100 | #45 | Exceptional 85.2% |
| Immigrants | Hong Kong | 99.8 /100 | #46 | Exceptional 85.2% |