Alaskan Athabascan vs Cape Verdean Hearing Disability
COMPARE
Alaskan Athabascan
Cape Verdean
Hearing Disability
Hearing Disability Comparison
Alaskan Athabascans
Cape Verdeans
5.3%
HEARING DISABILITY
0.0/ 100
METRIC RATING
345th/ 347
METRIC RANK
3.1%
HEARING DISABILITY
12.2/ 100
METRIC RATING
210th/ 347
METRIC RANK
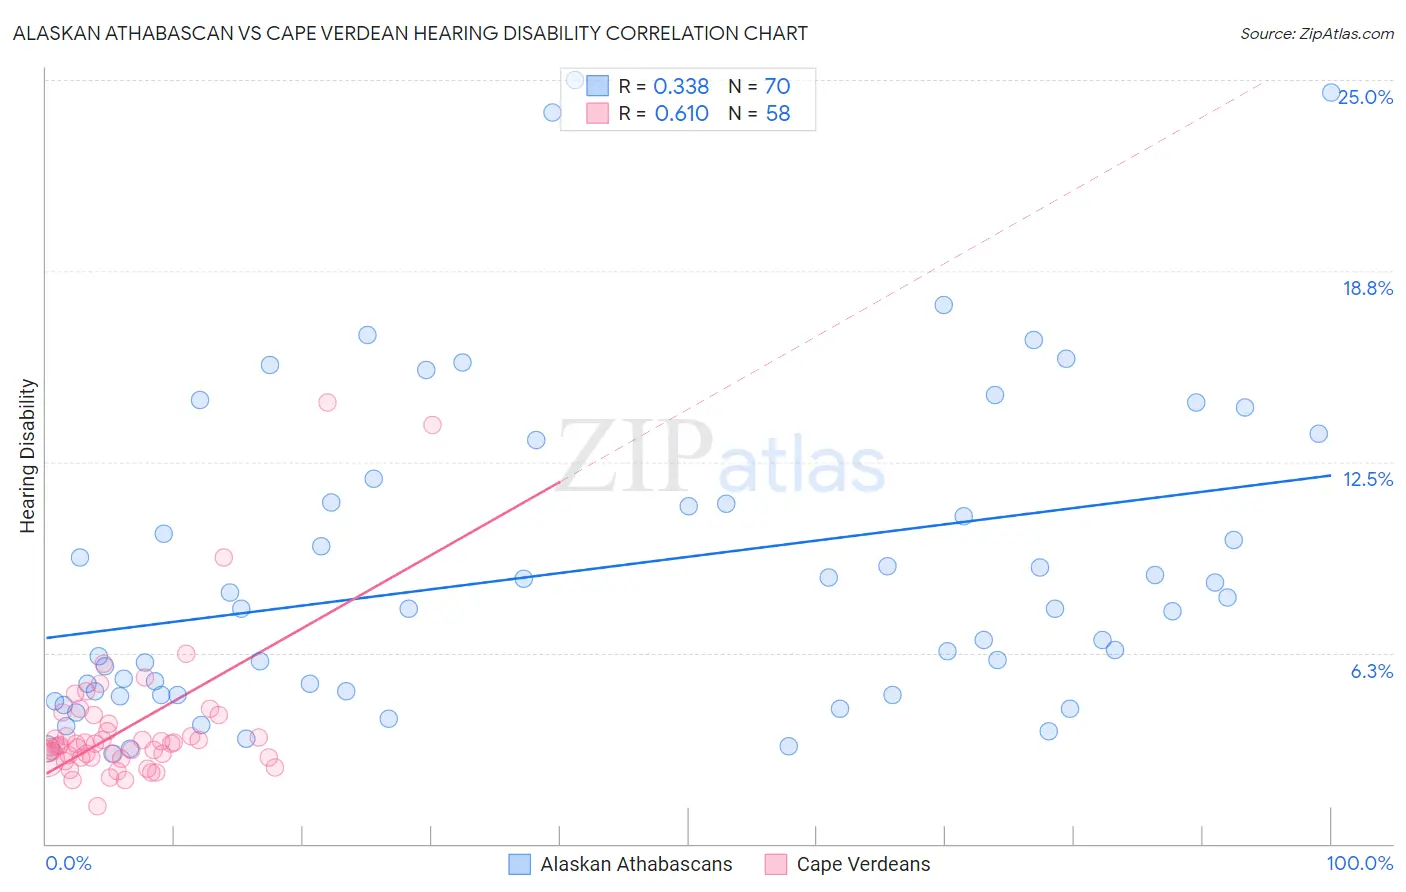
Alaskan Athabascan vs Cape Verdean Hearing Disability Correlation Chart
The statistical analysis conducted on geographies consisting of 45,819,269 people shows a mild positive correlation between the proportion of Alaskan Athabascans and percentage of population with hearing disability in the United States with a correlation coefficient (R) of 0.338 and weighted average of 5.3%. Similarly, the statistical analysis conducted on geographies consisting of 107,552,896 people shows a significant positive correlation between the proportion of Cape Verdeans and percentage of population with hearing disability in the United States with a correlation coefficient (R) of 0.610 and weighted average of 3.1%, a difference of 69.9%.
Hearing Disability Correlation Summary
| Measurement | Alaskan Athabascan | Cape Verdean |
| Minimum | 2.9% | 1.2% |
| Maximum | 25.0% | 14.5% |
| Range | 22.1% | 13.2% |
| Mean | 9.0% | 3.8% |
| Median | 7.7% | 3.2% |
| Interquartile 25% (IQ1) | 4.9% | 2.8% |
| Interquartile 75% (IQ3) | 11.2% | 3.9% |
| Interquartile Range (IQR) | 6.3% | 1.1% |
| Standard Deviation (Sample) | 5.2% | 2.3% |
| Standard Deviation (Population) | 5.2% | 2.3% |
Similar Demographics by Hearing Disability
Demographics Similar to Alaskan Athabascans by Hearing Disability
In terms of hearing disability, the demographic groups most similar to Alaskan Athabascans are Colville (5.3%, a difference of 0.43%), Yup'ik (5.8%, a difference of 9.7%), Tlingit-Haida (4.8%, a difference of 9.9%), Inupiat (4.7%, a difference of 12.9%), and Tsimshian (4.7%, a difference of 13.2%).
| Demographics | Rating | Rank | Hearing Disability |
| Dutch West Indians | 0.0 /100 | #333 | Tragic 4.3% |
| Aleuts | 0.0 /100 | #334 | Tragic 4.3% |
| Kiowa | 0.0 /100 | #335 | Tragic 4.3% |
| Creek | 0.0 /100 | #336 | Tragic 4.4% |
| Chickasaw | 0.0 /100 | #337 | Tragic 4.5% |
| Alaska Natives | 0.0 /100 | #338 | Tragic 4.5% |
| Choctaw | 0.0 /100 | #339 | Tragic 4.5% |
| Pueblo | 0.0 /100 | #340 | Tragic 4.6% |
| Navajo | 0.0 /100 | #341 | Tragic 4.6% |
| Tsimshian | 0.0 /100 | #342 | Tragic 4.7% |
| Inupiat | 0.0 /100 | #343 | Tragic 4.7% |
| Tlingit-Haida | 0.0 /100 | #344 | Tragic 4.8% |
| Alaskan Athabascans | 0.0 /100 | #345 | Tragic 5.3% |
| Colville | 0.0 /100 | #346 | Tragic 5.3% |
| Yup'ik | 0.0 /100 | #347 | Tragic 5.8% |
Demographics Similar to Cape Verdeans by Hearing Disability
In terms of hearing disability, the demographic groups most similar to Cape Verdeans are Romanian (3.1%, a difference of 0.040%), Immigrants from Hungary (3.1%, a difference of 0.050%), Immigrants from Latvia (3.1%, a difference of 0.090%), Pakistani (3.1%, a difference of 0.25%), and Immigrants from Iraq (3.1%, a difference of 0.39%).
| Demographics | Rating | Rank | Hearing Disability |
| Immigrants | Denmark | 16.2 /100 | #203 | Poor 3.1% |
| Immigrants | Czechoslovakia | 15.9 /100 | #204 | Poor 3.1% |
| Alsatians | 15.9 /100 | #205 | Poor 3.1% |
| Eastern Europeans | 15.5 /100 | #206 | Poor 3.1% |
| Hispanics or Latinos | 15.1 /100 | #207 | Poor 3.1% |
| Immigrants | Latvia | 12.7 /100 | #208 | Poor 3.1% |
| Immigrants | Hungary | 12.5 /100 | #209 | Poor 3.1% |
| Cape Verdeans | 12.2 /100 | #210 | Poor 3.1% |
| Romanians | 12.1 /100 | #211 | Poor 3.1% |
| Pakistanis | 11.1 /100 | #212 | Poor 3.1% |
| Immigrants | Iraq | 10.5 /100 | #213 | Poor 3.1% |
| Australians | 8.1 /100 | #214 | Tragic 3.2% |
| Bangladeshis | 8.1 /100 | #215 | Tragic 3.2% |
| Immigrants | Norway | 7.3 /100 | #216 | Tragic 3.2% |
| Russians | 7.1 /100 | #217 | Tragic 3.2% |