Guatemalan vs Cape Verdean In Labor Force | Age 35-44
COMPARE
Guatemalan
Cape Verdean
In Labor Force | Age 35-44
In Labor Force | Age 35-44 Comparison
Guatemalans
Cape Verdeans
83.0%
IN LABOR FORCE | AGE 35-44
0.0/ 100
METRIC RATING
281st/ 347
METRIC RANK
85.8%
IN LABOR FORCE | AGE 35-44
100.0/ 100
METRIC RATING
10th/ 347
METRIC RANK
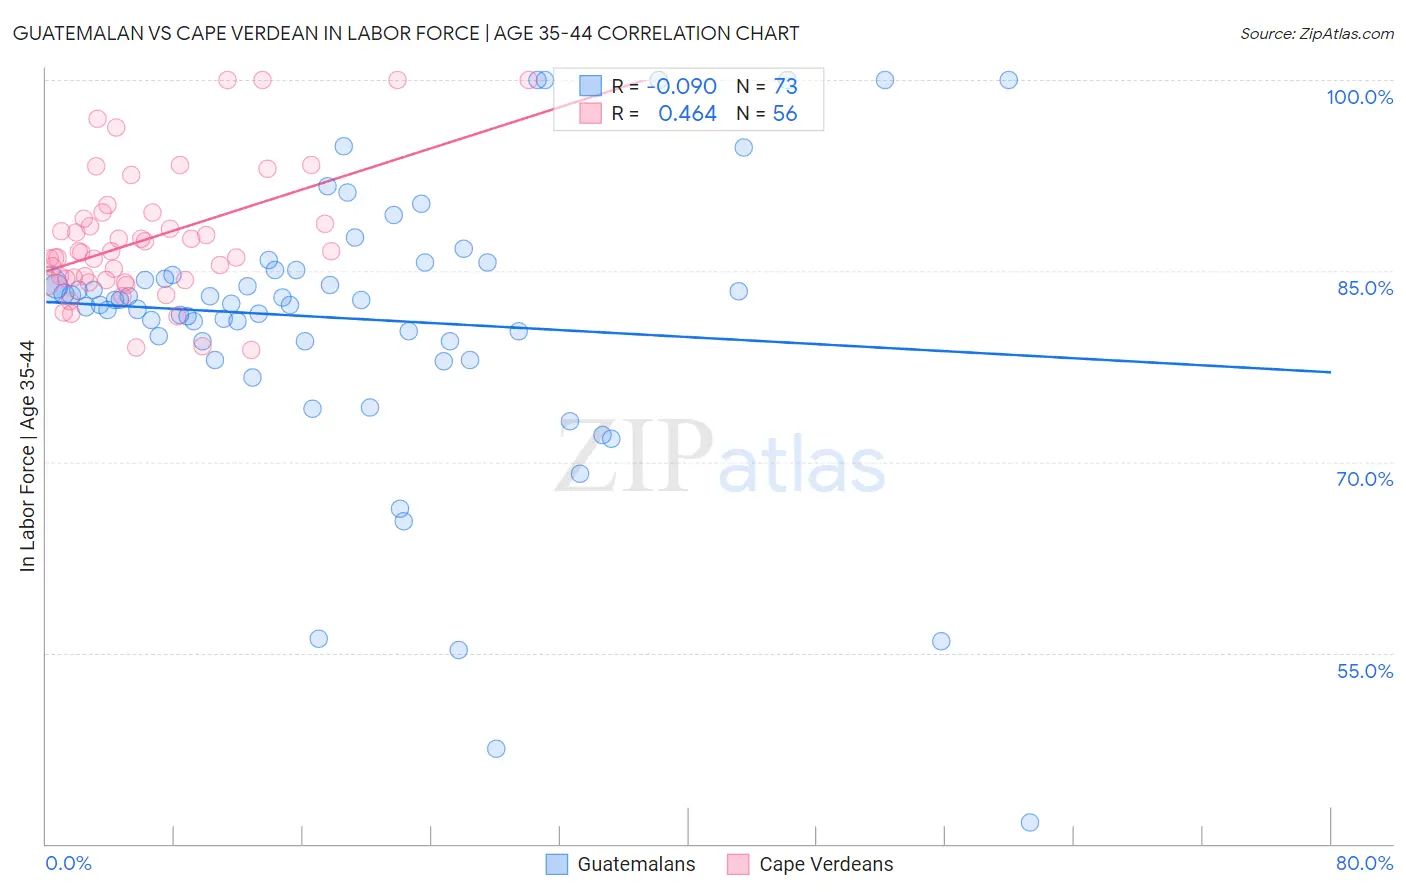
Guatemalan vs Cape Verdean In Labor Force | Age 35-44 Correlation Chart
The statistical analysis conducted on geographies consisting of 409,363,843 people shows a slight negative correlation between the proportion of Guatemalans and labor force participation rate among population between the ages 35 and 44 in the United States with a correlation coefficient (R) of -0.090 and weighted average of 83.0%. Similarly, the statistical analysis conducted on geographies consisting of 107,550,182 people shows a moderate positive correlation between the proportion of Cape Verdeans and labor force participation rate among population between the ages 35 and 44 in the United States with a correlation coefficient (R) of 0.464 and weighted average of 85.8%, a difference of 3.4%.
In Labor Force | Age 35-44 Correlation Summary
| Measurement | Guatemalan | Cape Verdean |
| Minimum | 41.7% | 78.8% |
| Maximum | 100.0% | 100.0% |
| Range | 58.3% | 21.2% |
| Mean | 81.2% | 87.5% |
| Median | 82.7% | 86.5% |
| Interquartile 25% (IQ1) | 79.5% | 84.3% |
| Interquartile 75% (IQ3) | 85.1% | 89.3% |
| Interquartile Range (IQR) | 5.6% | 5.0% |
| Standard Deviation (Sample) | 11.0% | 5.2% |
| Standard Deviation (Population) | 11.0% | 5.2% |
Similar Demographics by In Labor Force | Age 35-44
Demographics Similar to Guatemalans by In Labor Force | Age 35-44
In terms of in labor force | age 35-44, the demographic groups most similar to Guatemalans are Osage (82.9%, a difference of 0.040%), Immigrants from Guatemala (82.9%, a difference of 0.040%), Immigrants from Dominican Republic (82.9%, a difference of 0.050%), Fijian (82.9%, a difference of 0.060%), and Immigrants from Bangladesh (82.9%, a difference of 0.060%).
| Demographics | Rating | Rank | In Labor Force | Age 35-44 |
| Immigrants | Nonimmigrants | 0.0 /100 | #274 | Tragic 83.2% |
| Hawaiians | 0.0 /100 | #275 | Tragic 83.2% |
| Delaware | 0.0 /100 | #276 | Tragic 83.2% |
| Samoans | 0.0 /100 | #277 | Tragic 83.2% |
| Belizeans | 0.0 /100 | #278 | Tragic 83.1% |
| Immigrants | Micronesia | 0.0 /100 | #279 | Tragic 83.1% |
| Dominicans | 0.0 /100 | #280 | Tragic 83.1% |
| Guatemalans | 0.0 /100 | #281 | Tragic 83.0% |
| Osage | 0.0 /100 | #282 | Tragic 82.9% |
| Immigrants | Guatemala | 0.0 /100 | #283 | Tragic 82.9% |
| Immigrants | Dominican Republic | 0.0 /100 | #284 | Tragic 82.9% |
| Fijians | 0.0 /100 | #285 | Tragic 82.9% |
| Immigrants | Bangladesh | 0.0 /100 | #286 | Tragic 82.9% |
| Immigrants | Belize | 0.0 /100 | #287 | Tragic 82.9% |
| Puget Sound Salish | 0.0 /100 | #288 | Tragic 82.9% |
Demographics Similar to Cape Verdeans by In Labor Force | Age 35-44
In terms of in labor force | age 35-44, the demographic groups most similar to Cape Verdeans are Immigrants from Cameroon (85.8%, a difference of 0.030%), Immigrants from Ethiopia (85.9%, a difference of 0.13%), Ethiopian (85.9%, a difference of 0.13%), Liberian (85.7%, a difference of 0.15%), and Somali (85.6%, a difference of 0.17%).
| Demographics | Rating | Rank | In Labor Force | Age 35-44 |
| Immigrants | Bolivia | 100.0 /100 | #3 | Exceptional 86.2% |
| Immigrants | Cabo Verde | 100.0 /100 | #4 | Exceptional 86.2% |
| Zimbabweans | 100.0 /100 | #5 | Exceptional 86.1% |
| Bolivians | 100.0 /100 | #6 | Exceptional 86.1% |
| Immigrants | Sierra Leone | 100.0 /100 | #7 | Exceptional 86.1% |
| Immigrants | Ethiopia | 100.0 /100 | #8 | Exceptional 85.9% |
| Ethiopians | 100.0 /100 | #9 | Exceptional 85.9% |
| Cape Verdeans | 100.0 /100 | #10 | Exceptional 85.8% |
| Immigrants | Cameroon | 100.0 /100 | #11 | Exceptional 85.8% |
| Liberians | 100.0 /100 | #12 | Exceptional 85.7% |
| Somalis | 100.0 /100 | #13 | Exceptional 85.6% |
| Immigrants | Somalia | 100.0 /100 | #14 | Exceptional 85.6% |
| Norwegians | 100.0 /100 | #15 | Exceptional 85.6% |
| Immigrants | Ireland | 100.0 /100 | #16 | Exceptional 85.6% |
| Immigrants | North Macedonia | 100.0 /100 | #17 | Exceptional 85.6% |