Honduran vs Cape Verdean In Labor Force | Age 35-44
COMPARE
Honduran
Cape Verdean
In Labor Force | Age 35-44
In Labor Force | Age 35-44 Comparison
Hondurans
Cape Verdeans
83.4%
IN LABOR FORCE | AGE 35-44
0.1/ 100
METRIC RATING
268th/ 347
METRIC RANK
85.8%
IN LABOR FORCE | AGE 35-44
100.0/ 100
METRIC RATING
10th/ 347
METRIC RANK
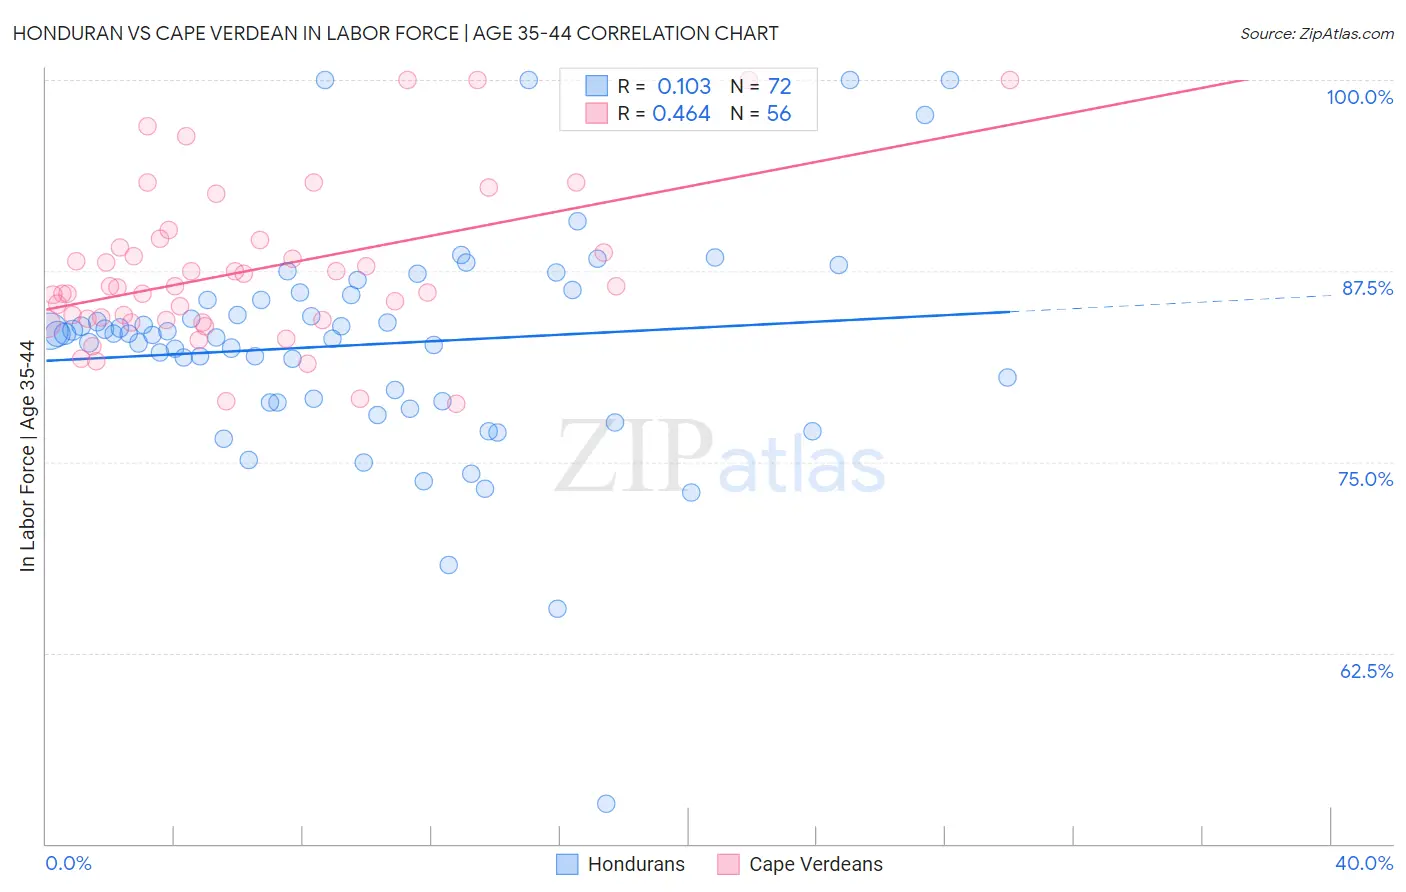
Honduran vs Cape Verdean In Labor Force | Age 35-44 Correlation Chart
The statistical analysis conducted on geographies consisting of 357,674,403 people shows a poor positive correlation between the proportion of Hondurans and labor force participation rate among population between the ages 35 and 44 in the United States with a correlation coefficient (R) of 0.103 and weighted average of 83.4%. Similarly, the statistical analysis conducted on geographies consisting of 107,550,182 people shows a moderate positive correlation between the proportion of Cape Verdeans and labor force participation rate among population between the ages 35 and 44 in the United States with a correlation coefficient (R) of 0.464 and weighted average of 85.8%, a difference of 2.9%.
In Labor Force | Age 35-44 Correlation Summary
| Measurement | Honduran | Cape Verdean |
| Minimum | 52.6% | 78.8% |
| Maximum | 100.0% | 100.0% |
| Range | 47.4% | 21.2% |
| Mean | 82.7% | 87.5% |
| Median | 83.4% | 86.5% |
| Interquartile 25% (IQ1) | 79.0% | 84.3% |
| Interquartile 75% (IQ3) | 85.8% | 89.3% |
| Interquartile Range (IQR) | 6.8% | 5.0% |
| Standard Deviation (Sample) | 7.5% | 5.2% |
| Standard Deviation (Population) | 7.4% | 5.2% |
Similar Demographics by In Labor Force | Age 35-44
Demographics Similar to Hondurans by In Labor Force | Age 35-44
In terms of in labor force | age 35-44, the demographic groups most similar to Hondurans are Immigrants from Grenada (83.3%, a difference of 0.010%), Guamanian/Chamorro (83.4%, a difference of 0.030%), Spaniard (83.4%, a difference of 0.080%), Scotch-Irish (83.5%, a difference of 0.12%), and Central American (83.5%, a difference of 0.12%).
| Demographics | Rating | Rank | In Labor Force | Age 35-44 |
| Immigrants | Dominica | 0.2 /100 | #261 | Tragic 83.5% |
| Immigrants | Congo | 0.2 /100 | #262 | Tragic 83.5% |
| Iroquois | 0.2 /100 | #263 | Tragic 83.5% |
| Scotch-Irish | 0.1 /100 | #264 | Tragic 83.5% |
| Central Americans | 0.1 /100 | #265 | Tragic 83.5% |
| Spaniards | 0.1 /100 | #266 | Tragic 83.4% |
| Guamanians/Chamorros | 0.1 /100 | #267 | Tragic 83.4% |
| Hondurans | 0.1 /100 | #268 | Tragic 83.4% |
| Immigrants | Grenada | 0.1 /100 | #269 | Tragic 83.3% |
| Immigrants | Honduras | 0.0 /100 | #270 | Tragic 83.3% |
| French American Indians | 0.0 /100 | #271 | Tragic 83.2% |
| Immigrants | Fiji | 0.0 /100 | #272 | Tragic 83.2% |
| Spanish | 0.0 /100 | #273 | Tragic 83.2% |
| Immigrants | Nonimmigrants | 0.0 /100 | #274 | Tragic 83.2% |
| Hawaiians | 0.0 /100 | #275 | Tragic 83.2% |
Demographics Similar to Cape Verdeans by In Labor Force | Age 35-44
In terms of in labor force | age 35-44, the demographic groups most similar to Cape Verdeans are Immigrants from Cameroon (85.8%, a difference of 0.030%), Immigrants from Ethiopia (85.9%, a difference of 0.13%), Ethiopian (85.9%, a difference of 0.13%), Liberian (85.7%, a difference of 0.15%), and Somali (85.6%, a difference of 0.17%).
| Demographics | Rating | Rank | In Labor Force | Age 35-44 |
| Immigrants | Bolivia | 100.0 /100 | #3 | Exceptional 86.2% |
| Immigrants | Cabo Verde | 100.0 /100 | #4 | Exceptional 86.2% |
| Zimbabweans | 100.0 /100 | #5 | Exceptional 86.1% |
| Bolivians | 100.0 /100 | #6 | Exceptional 86.1% |
| Immigrants | Sierra Leone | 100.0 /100 | #7 | Exceptional 86.1% |
| Immigrants | Ethiopia | 100.0 /100 | #8 | Exceptional 85.9% |
| Ethiopians | 100.0 /100 | #9 | Exceptional 85.9% |
| Cape Verdeans | 100.0 /100 | #10 | Exceptional 85.8% |
| Immigrants | Cameroon | 100.0 /100 | #11 | Exceptional 85.8% |
| Liberians | 100.0 /100 | #12 | Exceptional 85.7% |
| Somalis | 100.0 /100 | #13 | Exceptional 85.6% |
| Immigrants | Somalia | 100.0 /100 | #14 | Exceptional 85.6% |
| Norwegians | 100.0 /100 | #15 | Exceptional 85.6% |
| Immigrants | Ireland | 100.0 /100 | #16 | Exceptional 85.6% |
| Immigrants | North Macedonia | 100.0 /100 | #17 | Exceptional 85.6% |