Black/African American vs Lithuanian Median Earnings
COMPARE
Black/African American
Lithuanian
Median Earnings
Median Earnings Comparison
Blacks/African Americans
Lithuanians
$40,085
MEDIAN EARNINGS
0.0/ 100
METRIC RATING
319th/ 347
METRIC RANK
$50,991
MEDIAN EARNINGS
99.8/ 100
METRIC RATING
70th/ 347
METRIC RANK
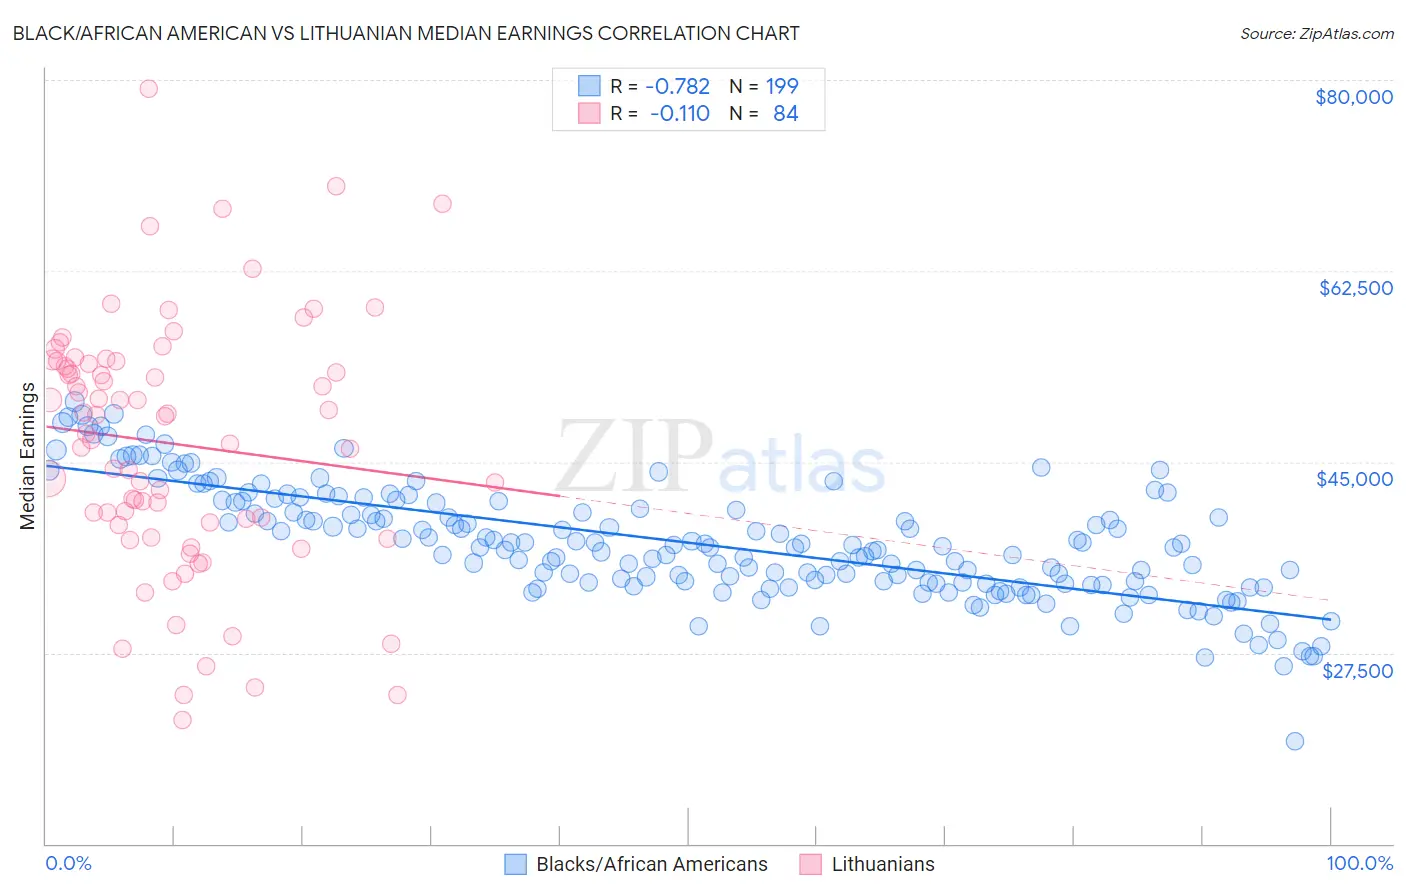
Black/African American vs Lithuanian Median Earnings Correlation Chart
The statistical analysis conducted on geographies consisting of 564,527,137 people shows a strong negative correlation between the proportion of Blacks/African Americans and median earnings in the United States with a correlation coefficient (R) of -0.782 and weighted average of $40,085. Similarly, the statistical analysis conducted on geographies consisting of 421,906,288 people shows a poor negative correlation between the proportion of Lithuanians and median earnings in the United States with a correlation coefficient (R) of -0.110 and weighted average of $50,991, a difference of 27.2%.
Median Earnings Correlation Summary
| Measurement | Black/African American | Lithuanian |
| Minimum | $19,448 | $21,331 |
| Maximum | $50,539 | $79,217 |
| Range | $31,091 | $57,886 |
| Mean | $37,581 | $46,654 |
| Median | $37,241 | $48,402 |
| Interquartile 25% (IQ1) | $33,915 | $39,359 |
| Interquartile 75% (IQ3) | $41,371 | $54,080 |
| Interquartile Range (IQR) | $7,457 | $14,721 |
| Standard Deviation (Sample) | $5,238 | $11,467 |
| Standard Deviation (Population) | $5,225 | $11,398 |
Similar Demographics by Median Earnings
Demographics Similar to Blacks/African Americans by Median Earnings
In terms of median earnings, the demographic groups most similar to Blacks/African Americans are Dutch West Indian ($40,107, a difference of 0.060%), Immigrants from Honduras ($40,195, a difference of 0.27%), Fijian ($40,193, a difference of 0.27%), Cheyenne ($40,233, a difference of 0.37%), and Seminole ($40,233, a difference of 0.37%).
| Demographics | Rating | Rank | Median Earnings |
| Chippewa | 0.0 /100 | #312 | Tragic $40,287 |
| Choctaw | 0.0 /100 | #313 | Tragic $40,270 |
| Cheyenne | 0.0 /100 | #314 | Tragic $40,233 |
| Seminole | 0.0 /100 | #315 | Tragic $40,233 |
| Immigrants | Honduras | 0.0 /100 | #316 | Tragic $40,195 |
| Fijians | 0.0 /100 | #317 | Tragic $40,193 |
| Dutch West Indians | 0.0 /100 | #318 | Tragic $40,107 |
| Blacks/African Americans | 0.0 /100 | #319 | Tragic $40,085 |
| Immigrants | Bahamas | 0.0 /100 | #320 | Tragic $39,861 |
| Mexicans | 0.0 /100 | #321 | Tragic $39,834 |
| Immigrants | Central America | 0.0 /100 | #322 | Tragic $39,762 |
| Bahamians | 0.0 /100 | #323 | Tragic $39,735 |
| Ottawa | 0.0 /100 | #324 | Tragic $39,721 |
| Creek | 0.0 /100 | #325 | Tragic $39,648 |
| Immigrants | Yemen | 0.0 /100 | #326 | Tragic $39,540 |
Demographics Similar to Lithuanians by Median Earnings
In terms of median earnings, the demographic groups most similar to Lithuanians are Immigrants from Ukraine ($50,984, a difference of 0.010%), Mongolian ($51,038, a difference of 0.090%), Paraguayan ($51,068, a difference of 0.15%), Immigrants from Egypt ($50,901, a difference of 0.18%), and Immigrants from Spain ($51,092, a difference of 0.20%).
| Demographics | Rating | Rank | Median Earnings |
| Immigrants | Bulgaria | 99.9 /100 | #63 | Exceptional $51,318 |
| New Zealanders | 99.9 /100 | #64 | Exceptional $51,246 |
| Greeks | 99.9 /100 | #65 | Exceptional $51,164 |
| Afghans | 99.9 /100 | #66 | Exceptional $51,112 |
| Immigrants | Spain | 99.9 /100 | #67 | Exceptional $51,092 |
| Paraguayans | 99.9 /100 | #68 | Exceptional $51,068 |
| Mongolians | 99.8 /100 | #69 | Exceptional $51,038 |
| Lithuanians | 99.8 /100 | #70 | Exceptional $50,991 |
| Immigrants | Ukraine | 99.8 /100 | #71 | Exceptional $50,984 |
| Immigrants | Egypt | 99.8 /100 | #72 | Exceptional $50,901 |
| Immigrants | Netherlands | 99.8 /100 | #73 | Exceptional $50,818 |
| South Africans | 99.8 /100 | #74 | Exceptional $50,752 |
| Immigrants | Scotland | 99.8 /100 | #75 | Exceptional $50,741 |
| Immigrants | Italy | 99.7 /100 | #76 | Exceptional $50,581 |
| Immigrants | Western Europe | 99.7 /100 | #77 | Exceptional $50,549 |