Black/African American vs Immigrants from Turkey Median Earnings
COMPARE
Black/African American
Immigrants from Turkey
Median Earnings
Median Earnings Comparison
Blacks/African Americans
Immigrants from Turkey
$40,085
MEDIAN EARNINGS
0.0/ 100
METRIC RATING
319th/ 347
METRIC RANK
$52,960
MEDIAN EARNINGS
100.0/ 100
METRIC RATING
39th/ 347
METRIC RANK
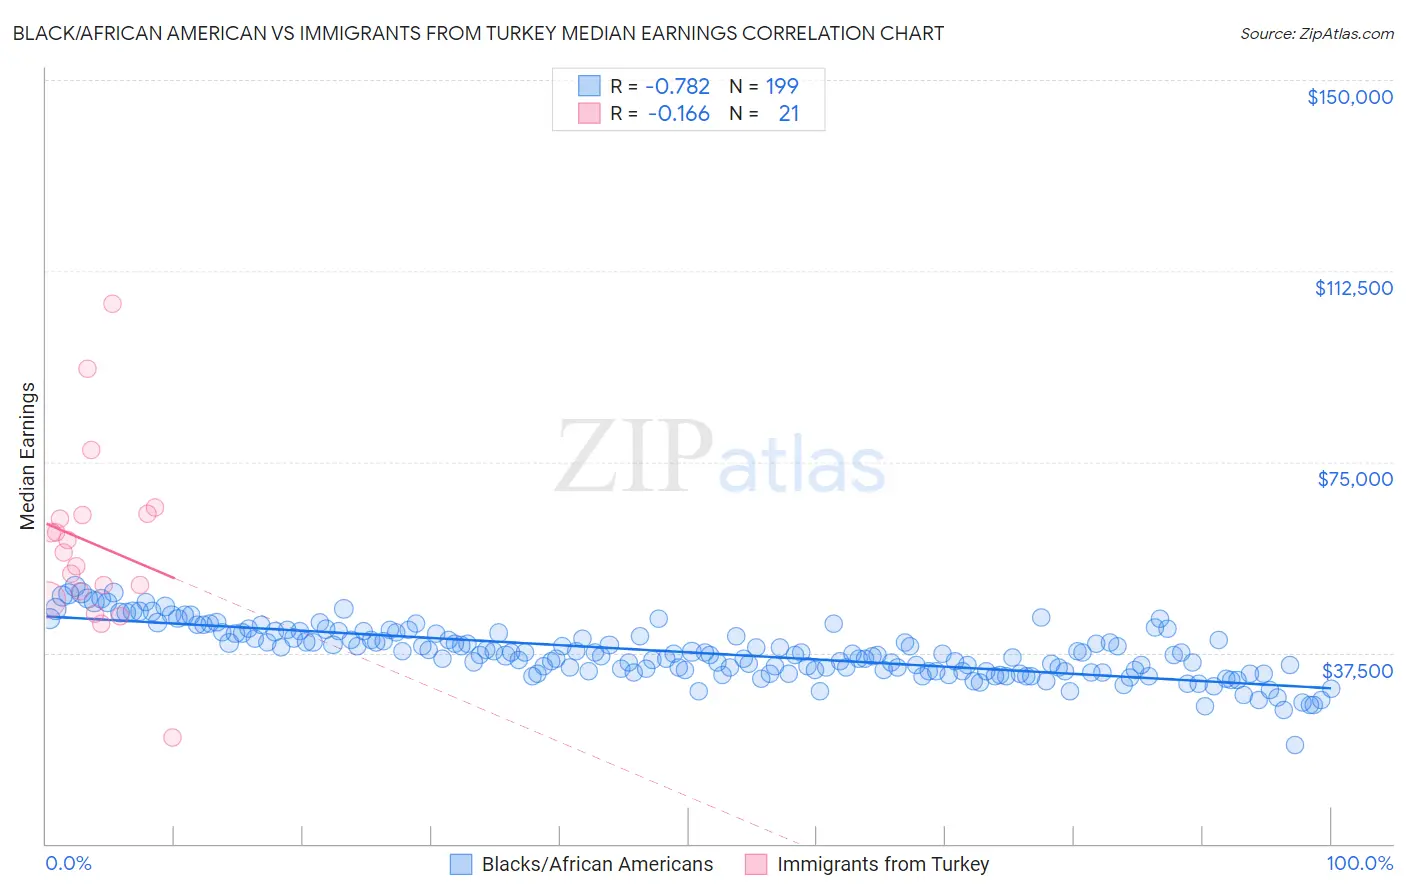
Black/African American vs Immigrants from Turkey Median Earnings Correlation Chart
The statistical analysis conducted on geographies consisting of 564,527,137 people shows a strong negative correlation between the proportion of Blacks/African Americans and median earnings in the United States with a correlation coefficient (R) of -0.782 and weighted average of $40,085. Similarly, the statistical analysis conducted on geographies consisting of 223,042,474 people shows a poor negative correlation between the proportion of Immigrants from Turkey and median earnings in the United States with a correlation coefficient (R) of -0.166 and weighted average of $52,960, a difference of 32.1%.
Median Earnings Correlation Summary
| Measurement | Black/African American | Immigrants from Turkey |
| Minimum | $19,448 | $20,750 |
| Maximum | $50,539 | $106,061 |
| Range | $31,091 | $85,311 |
| Mean | $37,581 | $58,831 |
| Median | $37,241 | $57,227 |
| Interquartile 25% (IQ1) | $33,915 | $48,717 |
| Interquartile 75% (IQ3) | $41,371 | $64,687 |
| Interquartile Range (IQR) | $7,457 | $15,970 |
| Standard Deviation (Sample) | $5,238 | $17,879 |
| Standard Deviation (Population) | $5,225 | $17,448 |
Similar Demographics by Median Earnings
Demographics Similar to Blacks/African Americans by Median Earnings
In terms of median earnings, the demographic groups most similar to Blacks/African Americans are Dutch West Indian ($40,107, a difference of 0.060%), Immigrants from Honduras ($40,195, a difference of 0.27%), Fijian ($40,193, a difference of 0.27%), Cheyenne ($40,233, a difference of 0.37%), and Seminole ($40,233, a difference of 0.37%).
| Demographics | Rating | Rank | Median Earnings |
| Chippewa | 0.0 /100 | #312 | Tragic $40,287 |
| Choctaw | 0.0 /100 | #313 | Tragic $40,270 |
| Cheyenne | 0.0 /100 | #314 | Tragic $40,233 |
| Seminole | 0.0 /100 | #315 | Tragic $40,233 |
| Immigrants | Honduras | 0.0 /100 | #316 | Tragic $40,195 |
| Fijians | 0.0 /100 | #317 | Tragic $40,193 |
| Dutch West Indians | 0.0 /100 | #318 | Tragic $40,107 |
| Blacks/African Americans | 0.0 /100 | #319 | Tragic $40,085 |
| Immigrants | Bahamas | 0.0 /100 | #320 | Tragic $39,861 |
| Mexicans | 0.0 /100 | #321 | Tragic $39,834 |
| Immigrants | Central America | 0.0 /100 | #322 | Tragic $39,762 |
| Bahamians | 0.0 /100 | #323 | Tragic $39,735 |
| Ottawa | 0.0 /100 | #324 | Tragic $39,721 |
| Creek | 0.0 /100 | #325 | Tragic $39,648 |
| Immigrants | Yemen | 0.0 /100 | #326 | Tragic $39,540 |
Demographics Similar to Immigrants from Turkey by Median Earnings
In terms of median earnings, the demographic groups most similar to Immigrants from Turkey are Israeli ($52,937, a difference of 0.040%), Latvian ($53,001, a difference of 0.080%), Immigrants from Belarus ($53,043, a difference of 0.16%), Immigrants from Lithuania ($52,769, a difference of 0.36%), and Immigrants from Denmark ($53,186, a difference of 0.43%).
| Demographics | Rating | Rank | Median Earnings |
| Immigrants | Asia | 100.0 /100 | #32 | Exceptional $53,310 |
| Immigrants | Greece | 100.0 /100 | #33 | Exceptional $53,282 |
| Immigrants | Sri Lanka | 100.0 /100 | #34 | Exceptional $53,268 |
| Immigrants | Switzerland | 100.0 /100 | #35 | Exceptional $53,211 |
| Immigrants | Denmark | 100.0 /100 | #36 | Exceptional $53,186 |
| Immigrants | Belarus | 100.0 /100 | #37 | Exceptional $53,043 |
| Latvians | 100.0 /100 | #38 | Exceptional $53,001 |
| Immigrants | Turkey | 100.0 /100 | #39 | Exceptional $52,960 |
| Israelis | 100.0 /100 | #40 | Exceptional $52,937 |
| Immigrants | Lithuania | 100.0 /100 | #41 | Exceptional $52,769 |
| Maltese | 100.0 /100 | #42 | Exceptional $52,526 |
| Immigrants | Malaysia | 100.0 /100 | #43 | Exceptional $52,514 |
| Bulgarians | 100.0 /100 | #44 | Exceptional $52,512 |
| Immigrants | Czechoslovakia | 100.0 /100 | #45 | Exceptional $52,361 |
| Bhutanese | 100.0 /100 | #46 | Exceptional $52,297 |