Zimbabwean vs Immigrants from Africa Median Male Earnings
COMPARE
Zimbabwean
Immigrants from Africa
Median Male Earnings
Median Male Earnings Comparison
Zimbabweans
Immigrants from Africa
$56,302
MEDIAN MALE EARNINGS
85.5/ 100
METRIC RATING
139th/ 347
METRIC RANK
$53,457
MEDIAN MALE EARNINGS
26.6/ 100
METRIC RATING
196th/ 347
METRIC RANK
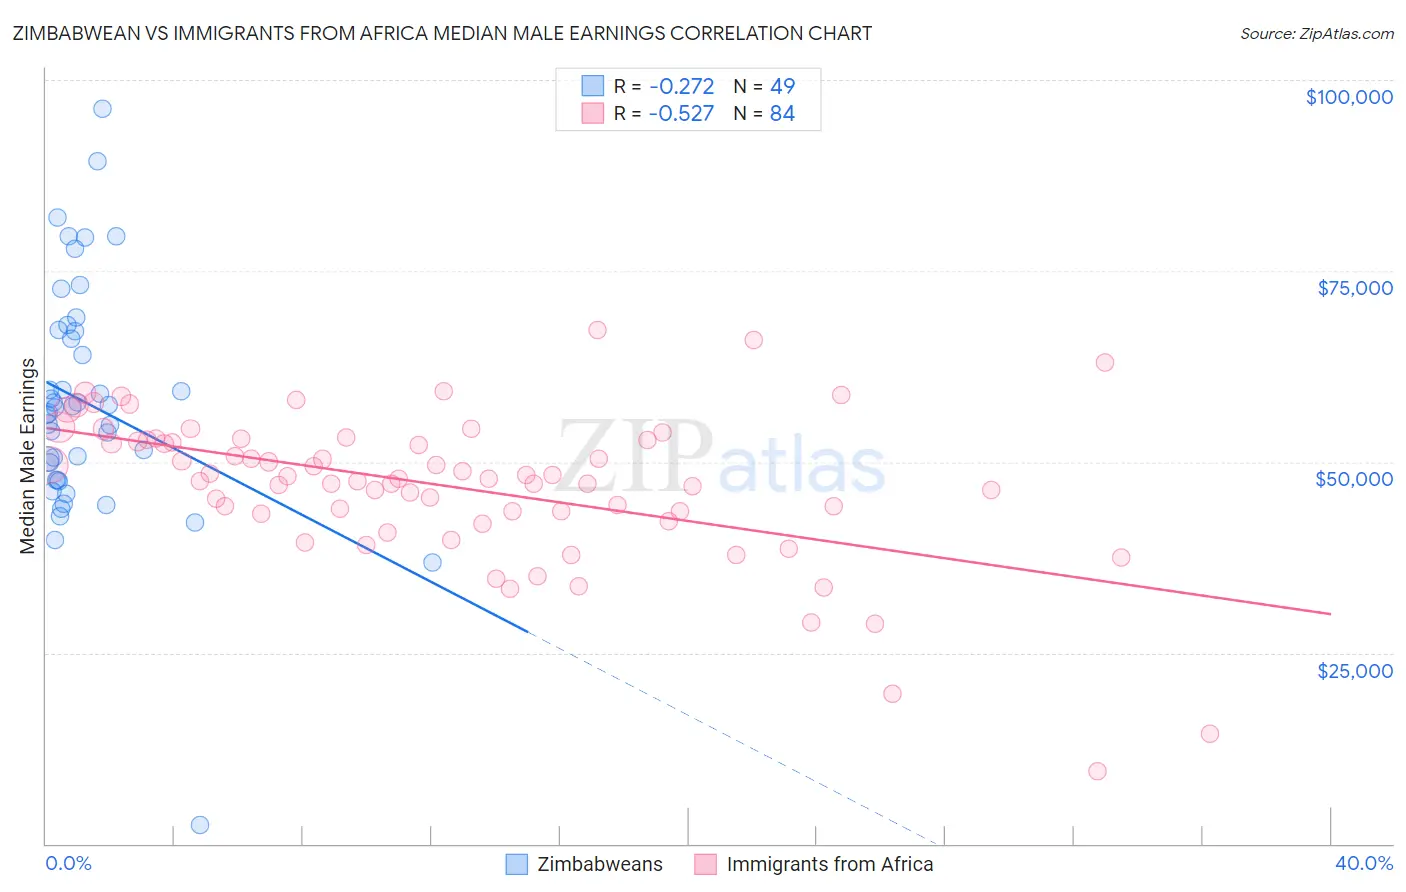
Zimbabwean vs Immigrants from Africa Median Male Earnings Correlation Chart
The statistical analysis conducted on geographies consisting of 69,206,147 people shows a weak negative correlation between the proportion of Zimbabweans and median male earnings in the United States with a correlation coefficient (R) of -0.272 and weighted average of $56,302. Similarly, the statistical analysis conducted on geographies consisting of 469,220,260 people shows a substantial negative correlation between the proportion of Immigrants from Africa and median male earnings in the United States with a correlation coefficient (R) of -0.527 and weighted average of $53,457, a difference of 5.3%.
Median Male Earnings Correlation Summary
| Measurement | Zimbabwean | Immigrants from Africa |
| Minimum | $2,499 | $9,467 |
| Maximum | $96,250 | $67,337 |
| Range | $93,751 | $57,870 |
| Mean | $57,721 | $46,791 |
| Median | $57,093 | $47,827 |
| Interquartile 25% (IQ1) | $47,581 | $43,316 |
| Interquartile 75% (IQ3) | $67,190 | $52,867 |
| Interquartile Range (IQR) | $19,609 | $9,551 |
| Standard Deviation (Sample) | $15,546 | $9,958 |
| Standard Deviation (Population) | $15,387 | $9,899 |
Similar Demographics by Median Male Earnings
Demographics Similar to Zimbabweans by Median Male Earnings
In terms of median male earnings, the demographic groups most similar to Zimbabweans are Luxembourger ($56,300, a difference of 0.0%), Slovak ($56,306, a difference of 0.010%), Danish ($56,246, a difference of 0.10%), Ethiopian ($56,243, a difference of 0.10%), and Slavic ($56,390, a difference of 0.16%).
| Demographics | Rating | Rank | Median Male Earnings |
| Czechs | 88.2 /100 | #132 | Excellent $56,546 |
| Immigrants | Germany | 88.2 /100 | #133 | Excellent $56,542 |
| Moroccans | 87.7 /100 | #134 | Excellent $56,499 |
| Irish | 87.4 /100 | #135 | Excellent $56,464 |
| Immigrants | Saudi Arabia | 87.2 /100 | #136 | Excellent $56,452 |
| Slavs | 86.5 /100 | #137 | Excellent $56,390 |
| Slovaks | 85.5 /100 | #138 | Excellent $56,306 |
| Zimbabweans | 85.5 /100 | #139 | Excellent $56,302 |
| Luxembourgers | 85.5 /100 | #140 | Excellent $56,300 |
| Danes | 84.8 /100 | #141 | Excellent $56,246 |
| Ethiopians | 84.8 /100 | #142 | Excellent $56,243 |
| Sri Lankans | 83.4 /100 | #143 | Excellent $56,136 |
| Immigrants | Uganda | 82.4 /100 | #144 | Excellent $56,064 |
| Norwegians | 80.9 /100 | #145 | Excellent $55,965 |
| Immigrants | Chile | 80.7 /100 | #146 | Excellent $55,954 |
Demographics Similar to Immigrants from Africa by Median Male Earnings
In terms of median male earnings, the demographic groups most similar to Immigrants from Africa are Immigrants from Kenya ($53,427, a difference of 0.060%), Immigrants from the Azores ($53,503, a difference of 0.090%), Spanish ($53,576, a difference of 0.22%), Kenyan ($53,647, a difference of 0.36%), and Guamanian/Chamorro ($53,661, a difference of 0.38%).
| Demographics | Rating | Rank | Median Male Earnings |
| Puget Sound Salish | 31.6 /100 | #189 | Fair $53,704 |
| Uruguayans | 31.1 /100 | #190 | Fair $53,680 |
| Guamanians/Chamorros | 30.7 /100 | #191 | Fair $53,661 |
| Scotch-Irish | 30.6 /100 | #192 | Fair $53,658 |
| Kenyans | 30.4 /100 | #193 | Fair $53,647 |
| Spanish | 29.0 /100 | #194 | Fair $53,576 |
| Immigrants | Azores | 27.5 /100 | #195 | Fair $53,503 |
| Immigrants | Africa | 26.6 /100 | #196 | Fair $53,457 |
| Immigrants | Kenya | 26.0 /100 | #197 | Fair $53,427 |
| Immigrants | Costa Rica | 22.6 /100 | #198 | Fair $53,237 |
| Tongans | 22.3 /100 | #199 | Fair $53,218 |
| Immigrants | Thailand | 17.5 /100 | #200 | Poor $52,908 |
| Immigrants | Bosnia and Herzegovina | 16.9 /100 | #201 | Poor $52,869 |
| Immigrants | Uruguay | 16.8 /100 | #202 | Poor $52,860 |
| Panamanians | 16.5 /100 | #203 | Poor $52,835 |