Immigrants from Cuba vs Immigrants from Africa Median Male Earnings
COMPARE
Immigrants from Cuba
Immigrants from Africa
Median Male Earnings
Median Male Earnings Comparison
Immigrants from Cuba
Immigrants from Africa
$43,461
MEDIAN MALE EARNINGS
0.0/ 100
METRIC RATING
336th/ 347
METRIC RANK
$53,457
MEDIAN MALE EARNINGS
26.6/ 100
METRIC RATING
196th/ 347
METRIC RANK
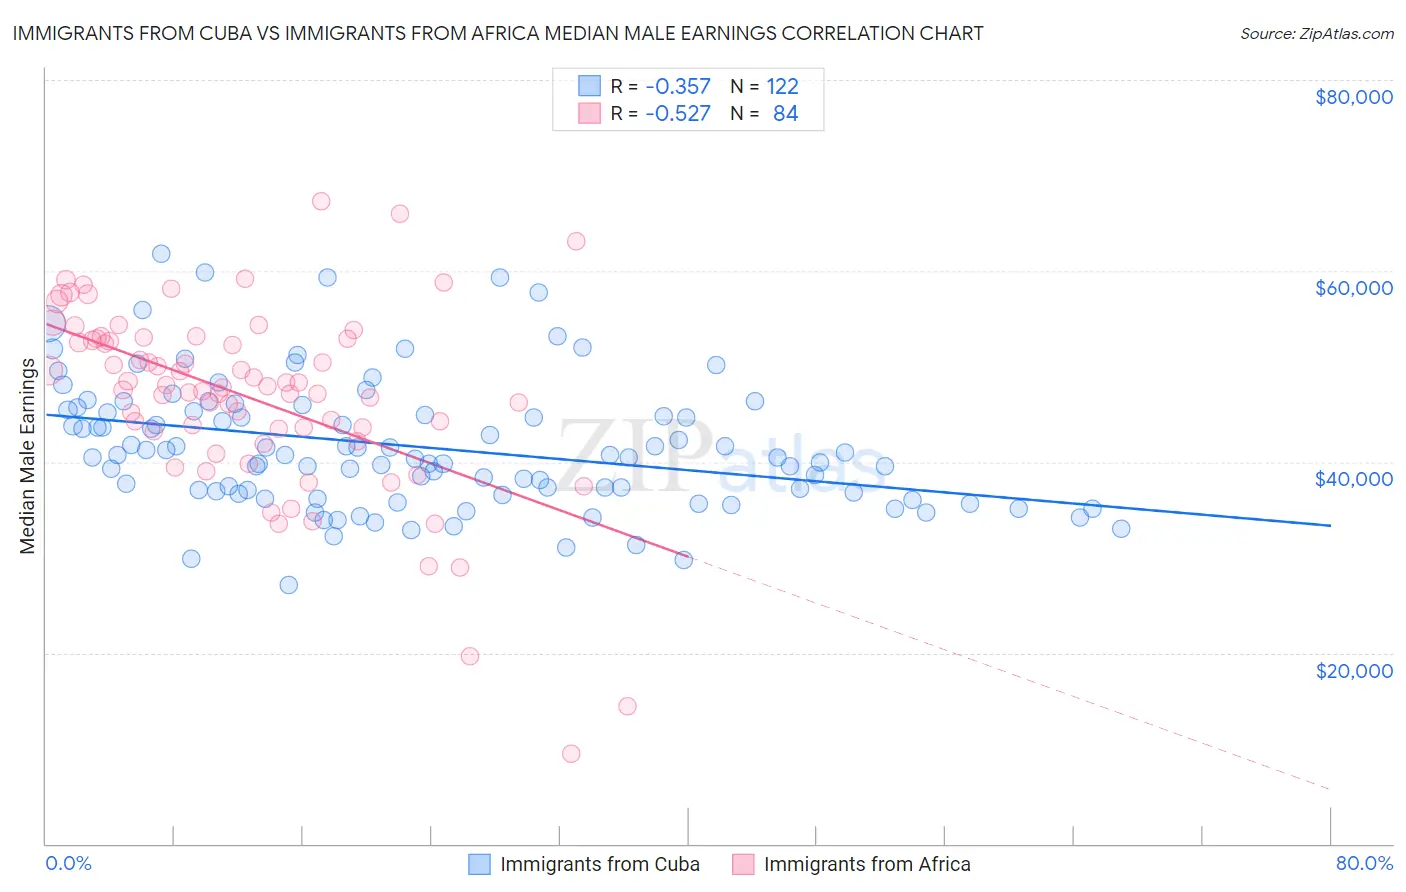
Immigrants from Cuba vs Immigrants from Africa Median Male Earnings Correlation Chart
The statistical analysis conducted on geographies consisting of 325,865,803 people shows a mild negative correlation between the proportion of Immigrants from Cuba and median male earnings in the United States with a correlation coefficient (R) of -0.357 and weighted average of $43,461. Similarly, the statistical analysis conducted on geographies consisting of 469,220,260 people shows a substantial negative correlation between the proportion of Immigrants from Africa and median male earnings in the United States with a correlation coefficient (R) of -0.527 and weighted average of $53,457, a difference of 23.0%.
Median Male Earnings Correlation Summary
| Measurement | Immigrants from Cuba | Immigrants from Africa |
| Minimum | $27,045 | $9,467 |
| Maximum | $61,830 | $67,337 |
| Range | $34,785 | $57,870 |
| Mean | $41,590 | $46,791 |
| Median | $40,567 | $47,827 |
| Interquartile 25% (IQ1) | $36,778 | $43,316 |
| Interquartile 75% (IQ3) | $45,280 | $52,867 |
| Interquartile Range (IQR) | $8,502 | $9,551 |
| Standard Deviation (Sample) | $6,813 | $9,958 |
| Standard Deviation (Population) | $6,785 | $9,899 |
Similar Demographics by Median Male Earnings
Demographics Similar to Immigrants from Cuba by Median Male Earnings
In terms of median male earnings, the demographic groups most similar to Immigrants from Cuba are Spanish American Indian ($44,010, a difference of 1.3%), Immigrants from Yemen ($44,083, a difference of 1.4%), Immigrants from Congo ($44,204, a difference of 1.7%), Menominee ($42,581, a difference of 2.1%), and Crow ($42,434, a difference of 2.4%).
| Demographics | Rating | Rank | Median Male Earnings |
| Yakama | 0.0 /100 | #329 | Tragic $45,002 |
| Immigrants | Mexico | 0.0 /100 | #330 | Tragic $44,960 |
| Natives/Alaskans | 0.0 /100 | #331 | Tragic $44,775 |
| Bahamians | 0.0 /100 | #332 | Tragic $44,756 |
| Immigrants | Congo | 0.0 /100 | #333 | Tragic $44,204 |
| Immigrants | Yemen | 0.0 /100 | #334 | Tragic $44,083 |
| Spanish American Indians | 0.0 /100 | #335 | Tragic $44,010 |
| Immigrants | Cuba | 0.0 /100 | #336 | Tragic $43,461 |
| Menominee | 0.0 /100 | #337 | Tragic $42,581 |
| Crow | 0.0 /100 | #338 | Tragic $42,434 |
| Pima | 0.0 /100 | #339 | Tragic $42,357 |
| Navajo | 0.0 /100 | #340 | Tragic $42,098 |
| Hopi | 0.0 /100 | #341 | Tragic $42,060 |
| Arapaho | 0.0 /100 | #342 | Tragic $41,758 |
| Lumbee | 0.0 /100 | #343 | Tragic $41,715 |
Demographics Similar to Immigrants from Africa by Median Male Earnings
In terms of median male earnings, the demographic groups most similar to Immigrants from Africa are Immigrants from Kenya ($53,427, a difference of 0.060%), Immigrants from the Azores ($53,503, a difference of 0.090%), Spanish ($53,576, a difference of 0.22%), Kenyan ($53,647, a difference of 0.36%), and Guamanian/Chamorro ($53,661, a difference of 0.38%).
| Demographics | Rating | Rank | Median Male Earnings |
| Puget Sound Salish | 31.6 /100 | #189 | Fair $53,704 |
| Uruguayans | 31.1 /100 | #190 | Fair $53,680 |
| Guamanians/Chamorros | 30.7 /100 | #191 | Fair $53,661 |
| Scotch-Irish | 30.6 /100 | #192 | Fair $53,658 |
| Kenyans | 30.4 /100 | #193 | Fair $53,647 |
| Spanish | 29.0 /100 | #194 | Fair $53,576 |
| Immigrants | Azores | 27.5 /100 | #195 | Fair $53,503 |
| Immigrants | Africa | 26.6 /100 | #196 | Fair $53,457 |
| Immigrants | Kenya | 26.0 /100 | #197 | Fair $53,427 |
| Immigrants | Costa Rica | 22.6 /100 | #198 | Fair $53,237 |
| Tongans | 22.3 /100 | #199 | Fair $53,218 |
| Immigrants | Thailand | 17.5 /100 | #200 | Poor $52,908 |
| Immigrants | Bosnia and Herzegovina | 16.9 /100 | #201 | Poor $52,869 |
| Immigrants | Uruguay | 16.8 /100 | #202 | Poor $52,860 |
| Panamanians | 16.5 /100 | #203 | Poor $52,835 |