Spaniard vs Immigrants from Africa Median Male Earnings
COMPARE
Spaniard
Immigrants from Africa
Median Male Earnings
Median Male Earnings Comparison
Spaniards
Immigrants from Africa
$54,401
MEDIAN MALE EARNINGS
47.8/ 100
METRIC RATING
176th/ 347
METRIC RANK
$53,457
MEDIAN MALE EARNINGS
26.6/ 100
METRIC RATING
196th/ 347
METRIC RANK
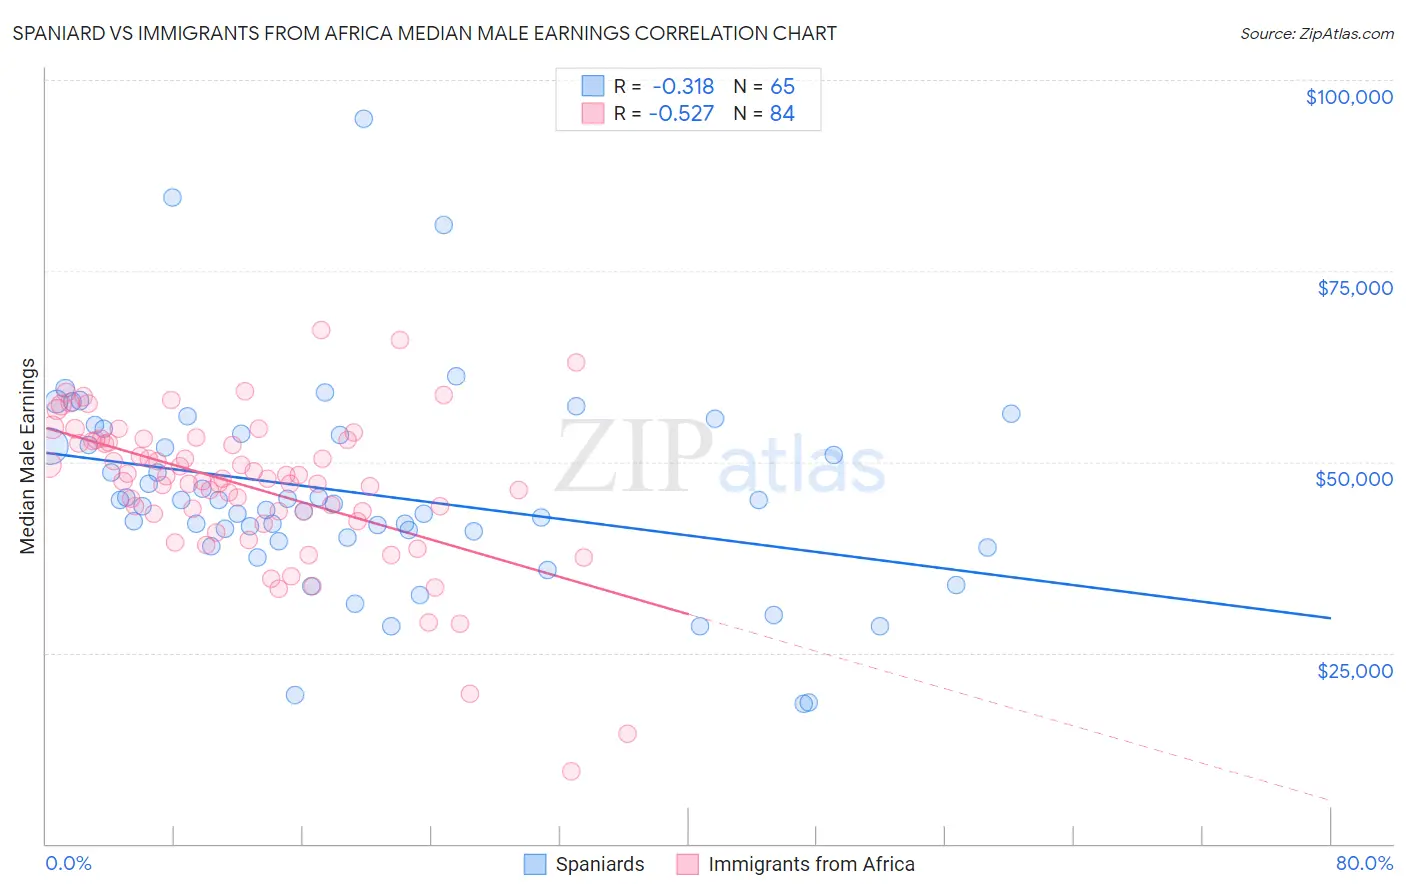
Spaniard vs Immigrants from Africa Median Male Earnings Correlation Chart
The statistical analysis conducted on geographies consisting of 443,330,517 people shows a mild negative correlation between the proportion of Spaniards and median male earnings in the United States with a correlation coefficient (R) of -0.318 and weighted average of $54,401. Similarly, the statistical analysis conducted on geographies consisting of 469,220,260 people shows a substantial negative correlation between the proportion of Immigrants from Africa and median male earnings in the United States with a correlation coefficient (R) of -0.527 and weighted average of $53,457, a difference of 1.8%.
Median Male Earnings Correlation Summary
| Measurement | Spaniard | Immigrants from Africa |
| Minimum | $18,319 | $9,467 |
| Maximum | $95,000 | $67,337 |
| Range | $76,681 | $57,870 |
| Mean | $45,902 | $46,791 |
| Median | $44,474 | $47,827 |
| Interquartile 25% (IQ1) | $39,886 | $43,316 |
| Interquartile 75% (IQ3) | $53,625 | $52,867 |
| Interquartile Range (IQR) | $13,740 | $9,551 |
| Standard Deviation (Sample) | $13,482 | $9,958 |
| Standard Deviation (Population) | $13,378 | $9,899 |
Demographics Similar to Spaniards and Immigrants from Africa by Median Male Earnings
In terms of median male earnings, the demographic groups most similar to Spaniards are Costa Rican ($54,279, a difference of 0.22%), Sierra Leonean ($54,279, a difference of 0.22%), Celtic ($54,242, a difference of 0.29%), Iraqi ($54,182, a difference of 0.40%), and Immigrants ($54,168, a difference of 0.43%). Similarly, the demographic groups most similar to Immigrants from Africa are Immigrants from the Azores ($53,503, a difference of 0.090%), Spanish ($53,576, a difference of 0.22%), Kenyan ($53,647, a difference of 0.36%), Guamanian/Chamorro ($53,661, a difference of 0.38%), and Scotch-Irish ($53,658, a difference of 0.38%).
| Demographics | Rating | Rank | Median Male Earnings |
| Spaniards | 47.8 /100 | #176 | Average $54,401 |
| Costa Ricans | 44.8 /100 | #177 | Average $54,279 |
| Sierra Leoneans | 44.8 /100 | #178 | Average $54,279 |
| Celtics | 43.9 /100 | #179 | Average $54,242 |
| Iraqis | 42.5 /100 | #180 | Average $54,182 |
| Immigrants | Immigrants | 42.1 /100 | #181 | Average $54,168 |
| Yugoslavians | 37.4 /100 | #182 | Fair $53,967 |
| Immigrants | South America | 37.3 /100 | #183 | Fair $53,962 |
| Whites/Caucasians | 36.5 /100 | #184 | Fair $53,925 |
| Immigrants | Sierra Leone | 36.0 /100 | #185 | Fair $53,905 |
| Colombians | 34.4 /100 | #186 | Fair $53,832 |
| Immigrants | Eritrea | 31.8 /100 | #187 | Fair $53,715 |
| Immigrants | Eastern Africa | 31.8 /100 | #188 | Fair $53,713 |
| Puget Sound Salish | 31.6 /100 | #189 | Fair $53,704 |
| Uruguayans | 31.1 /100 | #190 | Fair $53,680 |
| Guamanians/Chamorros | 30.7 /100 | #191 | Fair $53,661 |
| Scotch-Irish | 30.6 /100 | #192 | Fair $53,658 |
| Kenyans | 30.4 /100 | #193 | Fair $53,647 |
| Spanish | 29.0 /100 | #194 | Fair $53,576 |
| Immigrants | Azores | 27.5 /100 | #195 | Fair $53,503 |
| Immigrants | Africa | 26.6 /100 | #196 | Fair $53,457 |