Zimbabwean vs Dutch Median Male Earnings
COMPARE
Zimbabwean
Dutch
Median Male Earnings
Median Male Earnings Comparison
Zimbabweans
Dutch
$56,302
MEDIAN MALE EARNINGS
85.5/ 100
METRIC RATING
139th/ 347
METRIC RANK
$54,410
MEDIAN MALE EARNINGS
48.0/ 100
METRIC RATING
175th/ 347
METRIC RANK
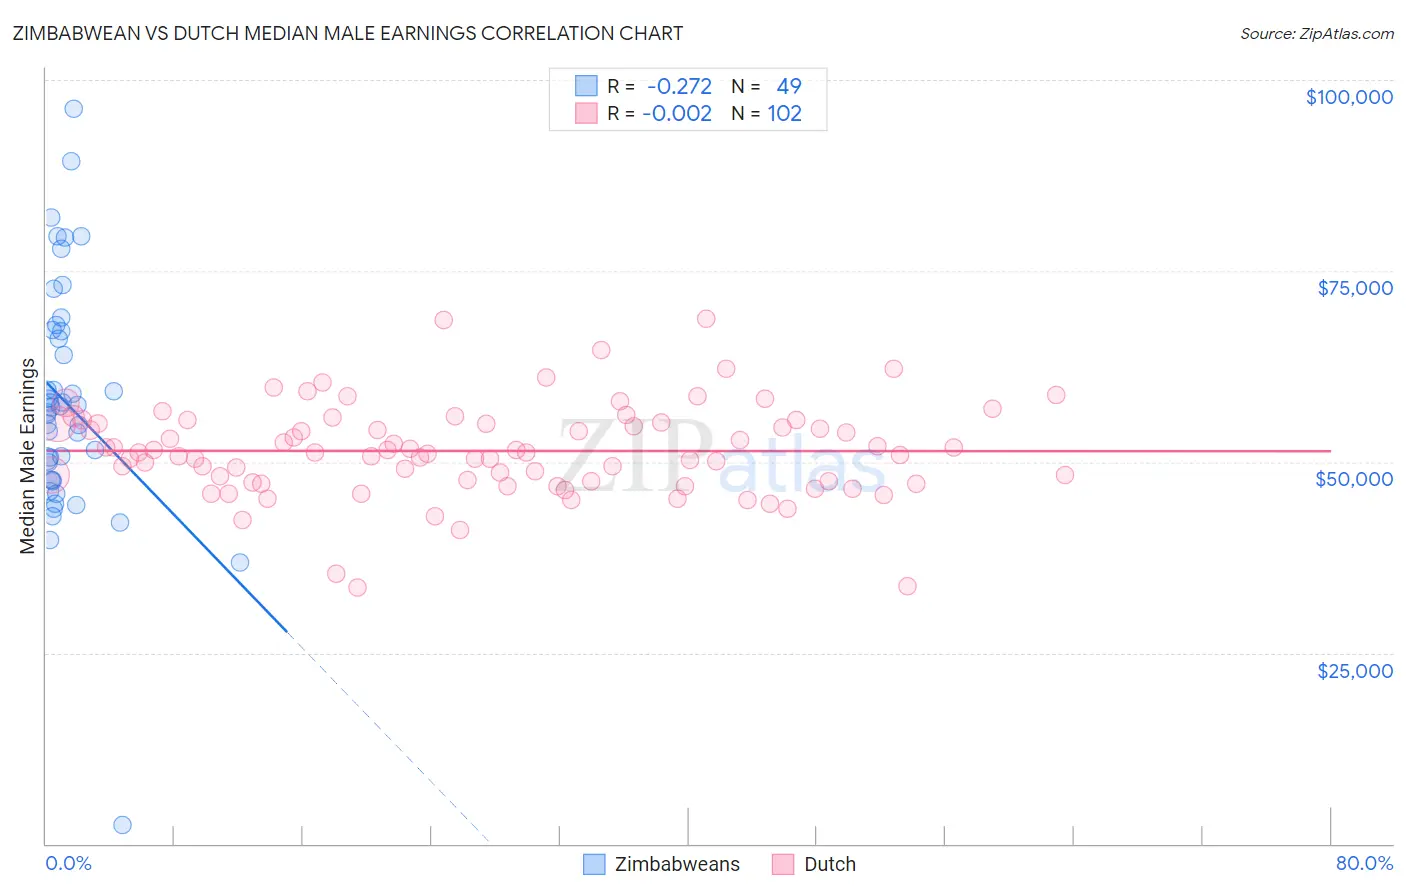
Zimbabwean vs Dutch Median Male Earnings Correlation Chart
The statistical analysis conducted on geographies consisting of 69,206,147 people shows a weak negative correlation between the proportion of Zimbabweans and median male earnings in the United States with a correlation coefficient (R) of -0.272 and weighted average of $56,302. Similarly, the statistical analysis conducted on geographies consisting of 553,393,301 people shows no correlation between the proportion of Dutch and median male earnings in the United States with a correlation coefficient (R) of -0.002 and weighted average of $54,410, a difference of 3.5%.
Median Male Earnings Correlation Summary
| Measurement | Zimbabwean | Dutch |
| Minimum | $2,499 | $33,485 |
| Maximum | $96,250 | $68,738 |
| Range | $93,751 | $35,252 |
| Mean | $57,721 | $51,429 |
| Median | $57,093 | $51,206 |
| Interquartile 25% (IQ1) | $47,581 | $47,383 |
| Interquartile 75% (IQ3) | $67,190 | $55,055 |
| Interquartile Range (IQR) | $19,609 | $7,672 |
| Standard Deviation (Sample) | $15,546 | $6,107 |
| Standard Deviation (Population) | $15,387 | $6,077 |
Similar Demographics by Median Male Earnings
Demographics Similar to Zimbabweans by Median Male Earnings
In terms of median male earnings, the demographic groups most similar to Zimbabweans are Luxembourger ($56,300, a difference of 0.0%), Slovak ($56,306, a difference of 0.010%), Danish ($56,246, a difference of 0.10%), Ethiopian ($56,243, a difference of 0.10%), and Slavic ($56,390, a difference of 0.16%).
| Demographics | Rating | Rank | Median Male Earnings |
| Czechs | 88.2 /100 | #132 | Excellent $56,546 |
| Immigrants | Germany | 88.2 /100 | #133 | Excellent $56,542 |
| Moroccans | 87.7 /100 | #134 | Excellent $56,499 |
| Irish | 87.4 /100 | #135 | Excellent $56,464 |
| Immigrants | Saudi Arabia | 87.2 /100 | #136 | Excellent $56,452 |
| Slavs | 86.5 /100 | #137 | Excellent $56,390 |
| Slovaks | 85.5 /100 | #138 | Excellent $56,306 |
| Zimbabweans | 85.5 /100 | #139 | Excellent $56,302 |
| Luxembourgers | 85.5 /100 | #140 | Excellent $56,300 |
| Danes | 84.8 /100 | #141 | Excellent $56,246 |
| Ethiopians | 84.8 /100 | #142 | Excellent $56,243 |
| Sri Lankans | 83.4 /100 | #143 | Excellent $56,136 |
| Immigrants | Uganda | 82.4 /100 | #144 | Excellent $56,064 |
| Norwegians | 80.9 /100 | #145 | Excellent $55,965 |
| Immigrants | Chile | 80.7 /100 | #146 | Excellent $55,954 |
Demographics Similar to Dutch by Median Male Earnings
In terms of median male earnings, the demographic groups most similar to Dutch are Spaniard ($54,401, a difference of 0.020%), South American ($54,492, a difference of 0.15%), South American Indian ($54,508, a difference of 0.18%), Costa Rican ($54,279, a difference of 0.24%), and Sierra Leonean ($54,279, a difference of 0.24%).
| Demographics | Rating | Rank | Median Male Earnings |
| Immigrants | Vietnam | 60.2 /100 | #168 | Good $54,913 |
| French Canadians | 55.6 /100 | #169 | Average $54,722 |
| Finns | 55.6 /100 | #170 | Average $54,721 |
| Immigrants | Peru | 54.9 /100 | #171 | Average $54,695 |
| Welsh | 53.8 /100 | #172 | Average $54,647 |
| South American Indians | 50.4 /100 | #173 | Average $54,508 |
| South Americans | 50.0 /100 | #174 | Average $54,492 |
| Dutch | 48.0 /100 | #175 | Average $54,410 |
| Spaniards | 47.8 /100 | #176 | Average $54,401 |
| Costa Ricans | 44.8 /100 | #177 | Average $54,279 |
| Sierra Leoneans | 44.8 /100 | #178 | Average $54,279 |
| Celtics | 43.9 /100 | #179 | Average $54,242 |
| Iraqis | 42.5 /100 | #180 | Average $54,182 |
| Immigrants | Immigrants | 42.1 /100 | #181 | Average $54,168 |
| Yugoslavians | 37.4 /100 | #182 | Fair $53,967 |