Zimbabwean vs Immigrants from Africa Median Household Income
COMPARE
Zimbabwean
Immigrants from Africa
Median Household Income
Median Household Income Comparison
Zimbabweans
Immigrants from Africa
$90,618
MEDIAN HOUSEHOLD INCOME
97.2/ 100
METRIC RATING
108th/ 347
METRIC RANK
$83,289
MEDIAN HOUSEHOLD INCOME
23.8/ 100
METRIC RATING
204th/ 347
METRIC RANK
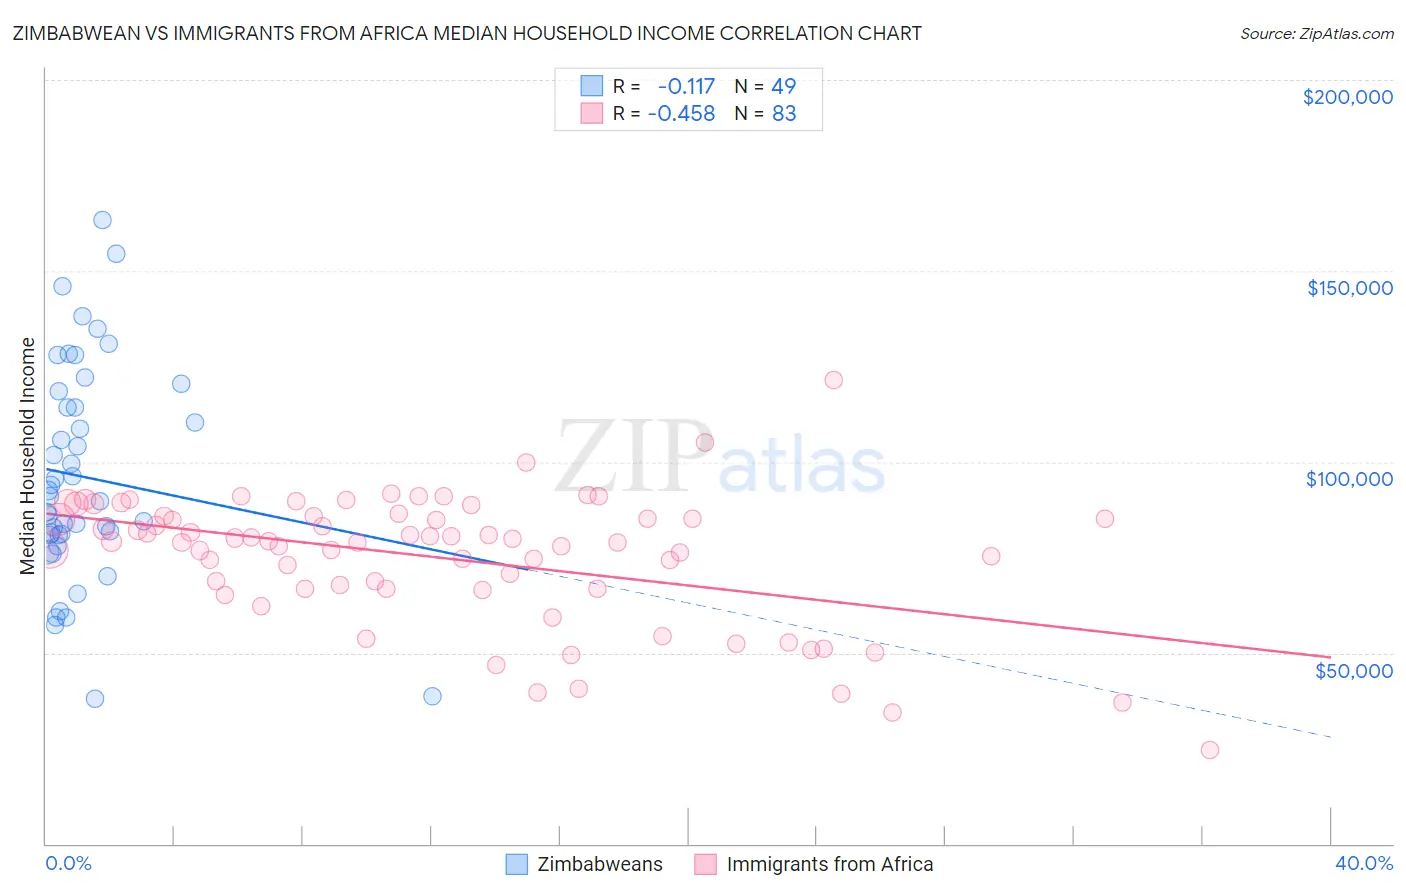
Zimbabwean vs Immigrants from Africa Median Household Income Correlation Chart
The statistical analysis conducted on geographies consisting of 69,185,411 people shows a poor negative correlation between the proportion of Zimbabweans and median household income in the United States with a correlation coefficient (R) of -0.117 and weighted average of $90,618. Similarly, the statistical analysis conducted on geographies consisting of 468,807,581 people shows a moderate negative correlation between the proportion of Immigrants from Africa and median household income in the United States with a correlation coefficient (R) of -0.458 and weighted average of $83,289, a difference of 8.8%.
Median Household Income Correlation Summary
| Measurement | Zimbabwean | Immigrants from Africa |
| Minimum | $38,056 | $24,660 |
| Maximum | $163,274 | $121,421 |
| Range | $125,218 | $96,761 |
| Mean | $96,050 | $74,867 |
| Median | $90,998 | $79,143 |
| Interquartile 25% (IQ1) | $80,817 | $66,824 |
| Interquartile 75% (IQ3) | $116,275 | $85,728 |
| Interquartile Range (IQR) | $35,458 | $18,904 |
| Standard Deviation (Sample) | $28,116 | $17,152 |
| Standard Deviation (Population) | $27,827 | $17,048 |
Similar Demographics by Median Household Income
Demographics Similar to Zimbabweans by Median Household Income
In terms of median household income, the demographic groups most similar to Zimbabweans are Chilean ($90,605, a difference of 0.020%), Palestinian ($90,574, a difference of 0.050%), Croatian ($90,685, a difference of 0.070%), Immigrants from Poland ($90,549, a difference of 0.080%), and Macedonian ($90,761, a difference of 0.16%).
| Demographics | Rating | Rank | Median Household Income |
| Immigrants | Moldova | 98.3 /100 | #101 | Exceptional $91,446 |
| Austrians | 98.2 /100 | #102 | Exceptional $91,339 |
| Immigrants | Ukraine | 98.0 /100 | #103 | Exceptional $91,124 |
| Immigrants | Kazakhstan | 97.8 /100 | #104 | Exceptional $91,015 |
| Immigrants | Brazil | 97.7 /100 | #105 | Exceptional $90,907 |
| Macedonians | 97.4 /100 | #106 | Exceptional $90,761 |
| Croatians | 97.3 /100 | #107 | Exceptional $90,685 |
| Zimbabweans | 97.2 /100 | #108 | Exceptional $90,618 |
| Chileans | 97.2 /100 | #109 | Exceptional $90,605 |
| Palestinians | 97.1 /100 | #110 | Exceptional $90,574 |
| Immigrants | Poland | 97.1 /100 | #111 | Exceptional $90,549 |
| Northern Europeans | 96.9 /100 | #112 | Exceptional $90,446 |
| Peruvians | 96.5 /100 | #113 | Exceptional $90,261 |
| Immigrants | Northern Africa | 95.9 /100 | #114 | Exceptional $90,026 |
| Immigrants | Western Asia | 95.9 /100 | #115 | Exceptional $90,005 |
Demographics Similar to Immigrants from Africa by Median Household Income
In terms of median household income, the demographic groups most similar to Immigrants from Africa are Immigrants from Cambodia ($83,304, a difference of 0.020%), Immigrants from Thailand ($83,327, a difference of 0.050%), Tsimshian ($83,346, a difference of 0.070%), Spanish ($83,343, a difference of 0.070%), and German ($83,358, a difference of 0.080%).
| Demographics | Rating | Rank | Median Household Income |
| Aleuts | 25.7 /100 | #197 | Fair $83,446 |
| Japanese | 25.1 /100 | #198 | Fair $83,395 |
| Germans | 24.6 /100 | #199 | Fair $83,358 |
| Tsimshian | 24.5 /100 | #200 | Fair $83,346 |
| Spanish | 24.4 /100 | #201 | Fair $83,343 |
| Immigrants | Thailand | 24.3 /100 | #202 | Fair $83,327 |
| Immigrants | Cambodia | 24.0 /100 | #203 | Fair $83,304 |
| Immigrants | Africa | 23.8 /100 | #204 | Fair $83,289 |
| Celtics | 22.7 /100 | #205 | Fair $83,193 |
| Immigrants | Kenya | 21.3 /100 | #206 | Fair $83,068 |
| Dutch | 20.3 /100 | #207 | Fair $82,971 |
| French Canadians | 18.7 /100 | #208 | Poor $82,810 |
| Immigrants | Iraq | 16.7 /100 | #209 | Poor $82,594 |
| Immigrants | Uruguay | 16.4 /100 | #210 | Poor $82,560 |
| Salvadorans | 15.4 /100 | #211 | Poor $82,449 |