Eastern European vs Immigrants from Africa Median Male Earnings
COMPARE
Eastern European
Immigrants from Africa
Median Male Earnings
Median Male Earnings Comparison
Eastern Europeans
Immigrants from Africa
$66,472
MEDIAN MALE EARNINGS
100.0/ 100
METRIC RATING
16th/ 347
METRIC RANK
$53,457
MEDIAN MALE EARNINGS
26.6/ 100
METRIC RATING
196th/ 347
METRIC RANK
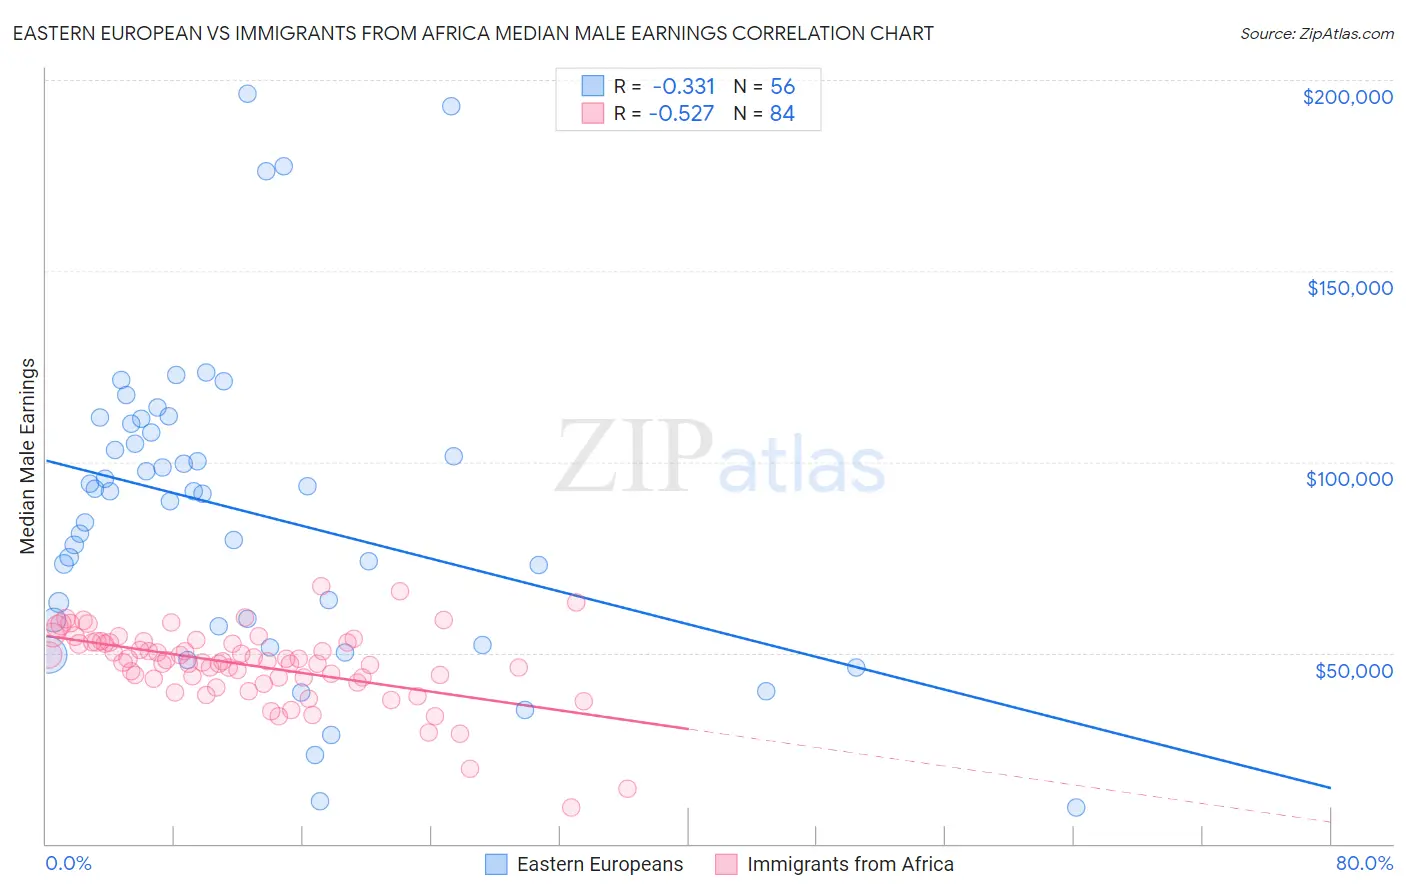
Eastern European vs Immigrants from Africa Median Male Earnings Correlation Chart
The statistical analysis conducted on geographies consisting of 460,960,346 people shows a mild negative correlation between the proportion of Eastern Europeans and median male earnings in the United States with a correlation coefficient (R) of -0.331 and weighted average of $66,472. Similarly, the statistical analysis conducted on geographies consisting of 469,220,260 people shows a substantial negative correlation between the proportion of Immigrants from Africa and median male earnings in the United States with a correlation coefficient (R) of -0.527 and weighted average of $53,457, a difference of 24.3%.
Median Male Earnings Correlation Summary
| Measurement | Eastern European | Immigrants from Africa |
| Minimum | $9,364 | $9,467 |
| Maximum | $196,250 | $67,337 |
| Range | $186,886 | $57,870 |
| Mean | $86,901 | $46,791 |
| Median | $91,970 | $47,827 |
| Interquartile 25% (IQ1) | $57,711 | $43,316 |
| Interquartile 75% (IQ3) | $108,812 | $52,867 |
| Interquartile Range (IQR) | $51,101 | $9,551 |
| Standard Deviation (Sample) | $40,387 | $9,958 |
| Standard Deviation (Population) | $40,024 | $9,899 |
Similar Demographics by Median Male Earnings
Demographics Similar to Eastern Europeans by Median Male Earnings
In terms of median male earnings, the demographic groups most similar to Eastern Europeans are Immigrants from Belgium ($66,125, a difference of 0.53%), Indian (Asian) ($66,078, a difference of 0.60%), Immigrants from Eastern Asia ($66,903, a difference of 0.65%), Okinawan ($67,232, a difference of 1.1%), and Immigrants from China ($67,353, a difference of 1.3%).
| Demographics | Rating | Rank | Median Male Earnings |
| Immigrants | South Central Asia | 100.0 /100 | #9 | Exceptional $68,960 |
| Immigrants | Israel | 100.0 /100 | #10 | Exceptional $68,716 |
| Immigrants | Ireland | 100.0 /100 | #11 | Exceptional $67,698 |
| Immigrants | Australia | 100.0 /100 | #12 | Exceptional $67,634 |
| Immigrants | China | 100.0 /100 | #13 | Exceptional $67,353 |
| Okinawans | 100.0 /100 | #14 | Exceptional $67,232 |
| Immigrants | Eastern Asia | 100.0 /100 | #15 | Exceptional $66,903 |
| Eastern Europeans | 100.0 /100 | #16 | Exceptional $66,472 |
| Immigrants | Belgium | 100.0 /100 | #17 | Exceptional $66,125 |
| Indians (Asian) | 100.0 /100 | #18 | Exceptional $66,078 |
| Cypriots | 100.0 /100 | #19 | Exceptional $65,549 |
| Immigrants | Japan | 100.0 /100 | #20 | Exceptional $65,518 |
| Immigrants | Sweden | 100.0 /100 | #21 | Exceptional $65,406 |
| Burmese | 100.0 /100 | #22 | Exceptional $65,236 |
| Immigrants | Korea | 100.0 /100 | #23 | Exceptional $65,079 |
Demographics Similar to Immigrants from Africa by Median Male Earnings
In terms of median male earnings, the demographic groups most similar to Immigrants from Africa are Immigrants from Kenya ($53,427, a difference of 0.060%), Immigrants from the Azores ($53,503, a difference of 0.090%), Spanish ($53,576, a difference of 0.22%), Kenyan ($53,647, a difference of 0.36%), and Guamanian/Chamorro ($53,661, a difference of 0.38%).
| Demographics | Rating | Rank | Median Male Earnings |
| Puget Sound Salish | 31.6 /100 | #189 | Fair $53,704 |
| Uruguayans | 31.1 /100 | #190 | Fair $53,680 |
| Guamanians/Chamorros | 30.7 /100 | #191 | Fair $53,661 |
| Scotch-Irish | 30.6 /100 | #192 | Fair $53,658 |
| Kenyans | 30.4 /100 | #193 | Fair $53,647 |
| Spanish | 29.0 /100 | #194 | Fair $53,576 |
| Immigrants | Azores | 27.5 /100 | #195 | Fair $53,503 |
| Immigrants | Africa | 26.6 /100 | #196 | Fair $53,457 |
| Immigrants | Kenya | 26.0 /100 | #197 | Fair $53,427 |
| Immigrants | Costa Rica | 22.6 /100 | #198 | Fair $53,237 |
| Tongans | 22.3 /100 | #199 | Fair $53,218 |
| Immigrants | Thailand | 17.5 /100 | #200 | Poor $52,908 |
| Immigrants | Bosnia and Herzegovina | 16.9 /100 | #201 | Poor $52,869 |
| Immigrants | Uruguay | 16.8 /100 | #202 | Poor $52,860 |
| Panamanians | 16.5 /100 | #203 | Poor $52,835 |