Zimbabwean vs Puget Sound Salish Median Male Earnings
COMPARE
Zimbabwean
Puget Sound Salish
Median Male Earnings
Median Male Earnings Comparison
Zimbabweans
Puget Sound Salish
$56,302
MEDIAN MALE EARNINGS
85.5/ 100
METRIC RATING
139th/ 347
METRIC RANK
$53,704
MEDIAN MALE EARNINGS
31.6/ 100
METRIC RATING
189th/ 347
METRIC RANK
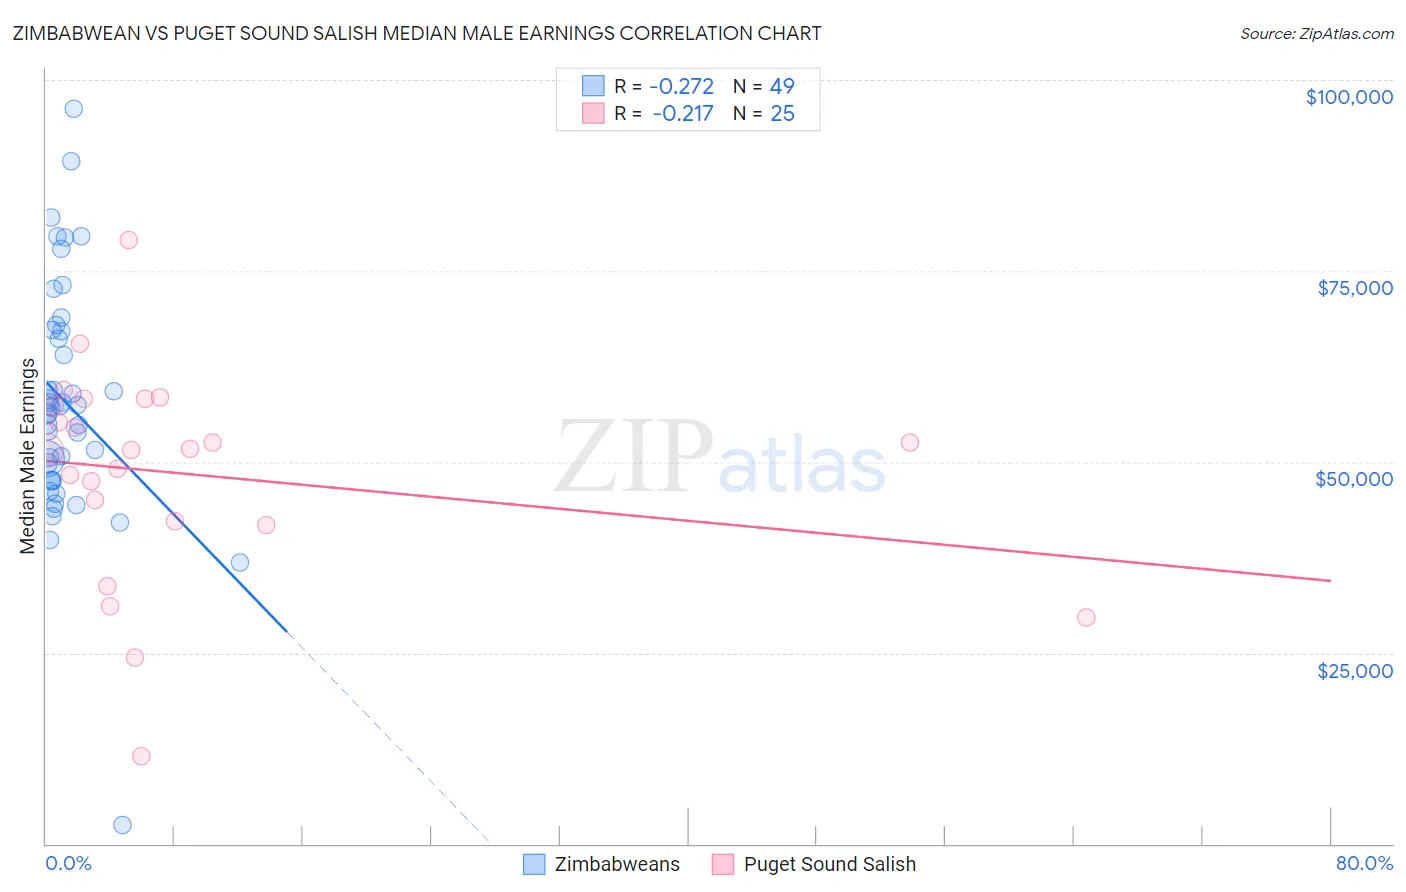
Zimbabwean vs Puget Sound Salish Median Male Earnings Correlation Chart
The statistical analysis conducted on geographies consisting of 69,206,147 people shows a weak negative correlation between the proportion of Zimbabweans and median male earnings in the United States with a correlation coefficient (R) of -0.272 and weighted average of $56,302. Similarly, the statistical analysis conducted on geographies consisting of 46,150,456 people shows a weak negative correlation between the proportion of Puget Sound Salish and median male earnings in the United States with a correlation coefficient (R) of -0.217 and weighted average of $53,704, a difference of 4.8%.
Median Male Earnings Correlation Summary
| Measurement | Zimbabwean | Puget Sound Salish |
| Minimum | $2,499 | $11,507 |
| Maximum | $96,250 | $79,042 |
| Range | $93,751 | $67,535 |
| Mean | $57,721 | $48,401 |
| Median | $57,093 | $51,583 |
| Interquartile 25% (IQ1) | $47,581 | $42,007 |
| Interquartile 75% (IQ3) | $67,190 | $57,855 |
| Interquartile Range (IQR) | $19,609 | $15,848 |
| Standard Deviation (Sample) | $15,546 | $14,112 |
| Standard Deviation (Population) | $15,387 | $13,827 |
Similar Demographics by Median Male Earnings
Demographics Similar to Zimbabweans by Median Male Earnings
In terms of median male earnings, the demographic groups most similar to Zimbabweans are Luxembourger ($56,300, a difference of 0.0%), Slovak ($56,306, a difference of 0.010%), Danish ($56,246, a difference of 0.10%), Ethiopian ($56,243, a difference of 0.10%), and Slavic ($56,390, a difference of 0.16%).
| Demographics | Rating | Rank | Median Male Earnings |
| Czechs | 88.2 /100 | #132 | Excellent $56,546 |
| Immigrants | Germany | 88.2 /100 | #133 | Excellent $56,542 |
| Moroccans | 87.7 /100 | #134 | Excellent $56,499 |
| Irish | 87.4 /100 | #135 | Excellent $56,464 |
| Immigrants | Saudi Arabia | 87.2 /100 | #136 | Excellent $56,452 |
| Slavs | 86.5 /100 | #137 | Excellent $56,390 |
| Slovaks | 85.5 /100 | #138 | Excellent $56,306 |
| Zimbabweans | 85.5 /100 | #139 | Excellent $56,302 |
| Luxembourgers | 85.5 /100 | #140 | Excellent $56,300 |
| Danes | 84.8 /100 | #141 | Excellent $56,246 |
| Ethiopians | 84.8 /100 | #142 | Excellent $56,243 |
| Sri Lankans | 83.4 /100 | #143 | Excellent $56,136 |
| Immigrants | Uganda | 82.4 /100 | #144 | Excellent $56,064 |
| Norwegians | 80.9 /100 | #145 | Excellent $55,965 |
| Immigrants | Chile | 80.7 /100 | #146 | Excellent $55,954 |
Demographics Similar to Puget Sound Salish by Median Male Earnings
In terms of median male earnings, the demographic groups most similar to Puget Sound Salish are Immigrants from Eritrea ($53,715, a difference of 0.020%), Immigrants from Eastern Africa ($53,713, a difference of 0.020%), Uruguayan ($53,680, a difference of 0.040%), Guamanian/Chamorro ($53,661, a difference of 0.080%), and Scotch-Irish ($53,658, a difference of 0.090%).
| Demographics | Rating | Rank | Median Male Earnings |
| Yugoslavians | 37.4 /100 | #182 | Fair $53,967 |
| Immigrants | South America | 37.3 /100 | #183 | Fair $53,962 |
| Whites/Caucasians | 36.5 /100 | #184 | Fair $53,925 |
| Immigrants | Sierra Leone | 36.0 /100 | #185 | Fair $53,905 |
| Colombians | 34.4 /100 | #186 | Fair $53,832 |
| Immigrants | Eritrea | 31.8 /100 | #187 | Fair $53,715 |
| Immigrants | Eastern Africa | 31.8 /100 | #188 | Fair $53,713 |
| Puget Sound Salish | 31.6 /100 | #189 | Fair $53,704 |
| Uruguayans | 31.1 /100 | #190 | Fair $53,680 |
| Guamanians/Chamorros | 30.7 /100 | #191 | Fair $53,661 |
| Scotch-Irish | 30.6 /100 | #192 | Fair $53,658 |
| Kenyans | 30.4 /100 | #193 | Fair $53,647 |
| Spanish | 29.0 /100 | #194 | Fair $53,576 |
| Immigrants | Azores | 27.5 /100 | #195 | Fair $53,503 |
| Immigrants | Africa | 26.6 /100 | #196 | Fair $53,457 |