Zimbabwean vs Ecuadorian Median Male Earnings
COMPARE
Zimbabwean
Ecuadorian
Median Male Earnings
Median Male Earnings Comparison
Zimbabweans
Ecuadorians
$56,302
MEDIAN MALE EARNINGS
85.5/ 100
METRIC RATING
139th/ 347
METRIC RANK
$51,596
MEDIAN MALE EARNINGS
5.5/ 100
METRIC RATING
223rd/ 347
METRIC RANK
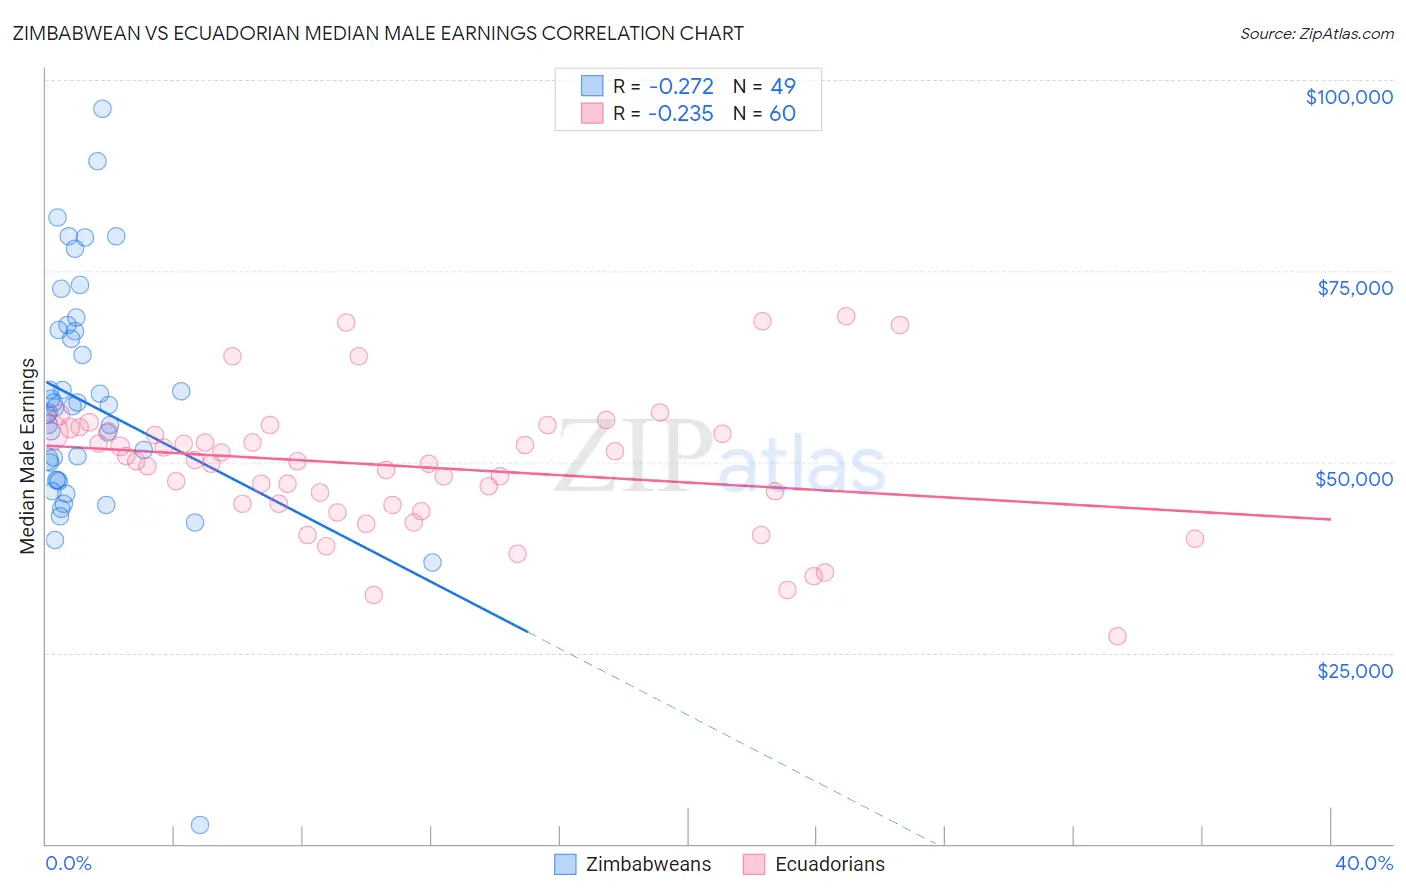
Zimbabwean vs Ecuadorian Median Male Earnings Correlation Chart
The statistical analysis conducted on geographies consisting of 69,206,147 people shows a weak negative correlation between the proportion of Zimbabweans and median male earnings in the United States with a correlation coefficient (R) of -0.272 and weighted average of $56,302. Similarly, the statistical analysis conducted on geographies consisting of 317,782,884 people shows a weak negative correlation between the proportion of Ecuadorians and median male earnings in the United States with a correlation coefficient (R) of -0.235 and weighted average of $51,596, a difference of 9.1%.
Median Male Earnings Correlation Summary
| Measurement | Zimbabwean | Ecuadorian |
| Minimum | $2,499 | $27,125 |
| Maximum | $96,250 | $69,080 |
| Range | $93,751 | $41,955 |
| Mean | $57,721 | $49,474 |
| Median | $57,093 | $50,085 |
| Interquartile 25% (IQ1) | $47,581 | $44,427 |
| Interquartile 75% (IQ3) | $67,190 | $53,952 |
| Interquartile Range (IQR) | $19,609 | $9,525 |
| Standard Deviation (Sample) | $15,546 | $8,750 |
| Standard Deviation (Population) | $15,387 | $8,677 |
Similar Demographics by Median Male Earnings
Demographics Similar to Zimbabweans by Median Male Earnings
In terms of median male earnings, the demographic groups most similar to Zimbabweans are Luxembourger ($56,300, a difference of 0.0%), Slovak ($56,306, a difference of 0.010%), Danish ($56,246, a difference of 0.10%), Ethiopian ($56,243, a difference of 0.10%), and Slavic ($56,390, a difference of 0.16%).
| Demographics | Rating | Rank | Median Male Earnings |
| Czechs | 88.2 /100 | #132 | Excellent $56,546 |
| Immigrants | Germany | 88.2 /100 | #133 | Excellent $56,542 |
| Moroccans | 87.7 /100 | #134 | Excellent $56,499 |
| Irish | 87.4 /100 | #135 | Excellent $56,464 |
| Immigrants | Saudi Arabia | 87.2 /100 | #136 | Excellent $56,452 |
| Slavs | 86.5 /100 | #137 | Excellent $56,390 |
| Slovaks | 85.5 /100 | #138 | Excellent $56,306 |
| Zimbabweans | 85.5 /100 | #139 | Excellent $56,302 |
| Luxembourgers | 85.5 /100 | #140 | Excellent $56,300 |
| Danes | 84.8 /100 | #141 | Excellent $56,246 |
| Ethiopians | 84.8 /100 | #142 | Excellent $56,243 |
| Sri Lankans | 83.4 /100 | #143 | Excellent $56,136 |
| Immigrants | Uganda | 82.4 /100 | #144 | Excellent $56,064 |
| Norwegians | 80.9 /100 | #145 | Excellent $55,965 |
| Immigrants | Chile | 80.7 /100 | #146 | Excellent $55,954 |
Demographics Similar to Ecuadorians by Median Male Earnings
In terms of median male earnings, the demographic groups most similar to Ecuadorians are Immigrants from Cambodia ($51,594, a difference of 0.0%), Immigrants from Bangladesh ($51,642, a difference of 0.090%), Immigrants from Senegal ($51,647, a difference of 0.10%), Immigrants from Sudan ($51,489, a difference of 0.21%), and Japanese ($51,473, a difference of 0.24%).
| Demographics | Rating | Rank | Median Male Earnings |
| Immigrants | Venezuela | 8.3 /100 | #216 | Tragic $52,041 |
| Nigerians | 8.3 /100 | #217 | Tragic $52,039 |
| Immigrants | Panama | 7.7 /100 | #218 | Tragic $51,962 |
| Immigrants | Ghana | 6.9 /100 | #219 | Tragic $51,836 |
| Immigrants | Armenia | 6.6 /100 | #220 | Tragic $51,793 |
| Immigrants | Senegal | 5.8 /100 | #221 | Tragic $51,647 |
| Immigrants | Bangladesh | 5.8 /100 | #222 | Tragic $51,642 |
| Ecuadorians | 5.5 /100 | #223 | Tragic $51,596 |
| Immigrants | Cambodia | 5.5 /100 | #224 | Tragic $51,594 |
| Immigrants | Sudan | 5.0 /100 | #225 | Tragic $51,489 |
| Japanese | 4.9 /100 | #226 | Tragic $51,473 |
| Trinidadians and Tobagonians | 4.8 /100 | #227 | Tragic $51,446 |
| Samoans | 4.6 /100 | #228 | Tragic $51,389 |
| Immigrants | Trinidad and Tobago | 4.5 /100 | #229 | Tragic $51,376 |
| Immigrants | Nigeria | 4.2 /100 | #230 | Tragic $51,310 |