Zimbabwean vs Alsatian Median Male Earnings
COMPARE
Zimbabwean
Alsatian
Median Male Earnings
Median Male Earnings Comparison
Zimbabweans
Alsatians
$56,302
MEDIAN MALE EARNINGS
85.5/ 100
METRIC RATING
139th/ 347
METRIC RANK
$55,380
MEDIAN MALE EARNINGS
70.5/ 100
METRIC RATING
159th/ 347
METRIC RANK
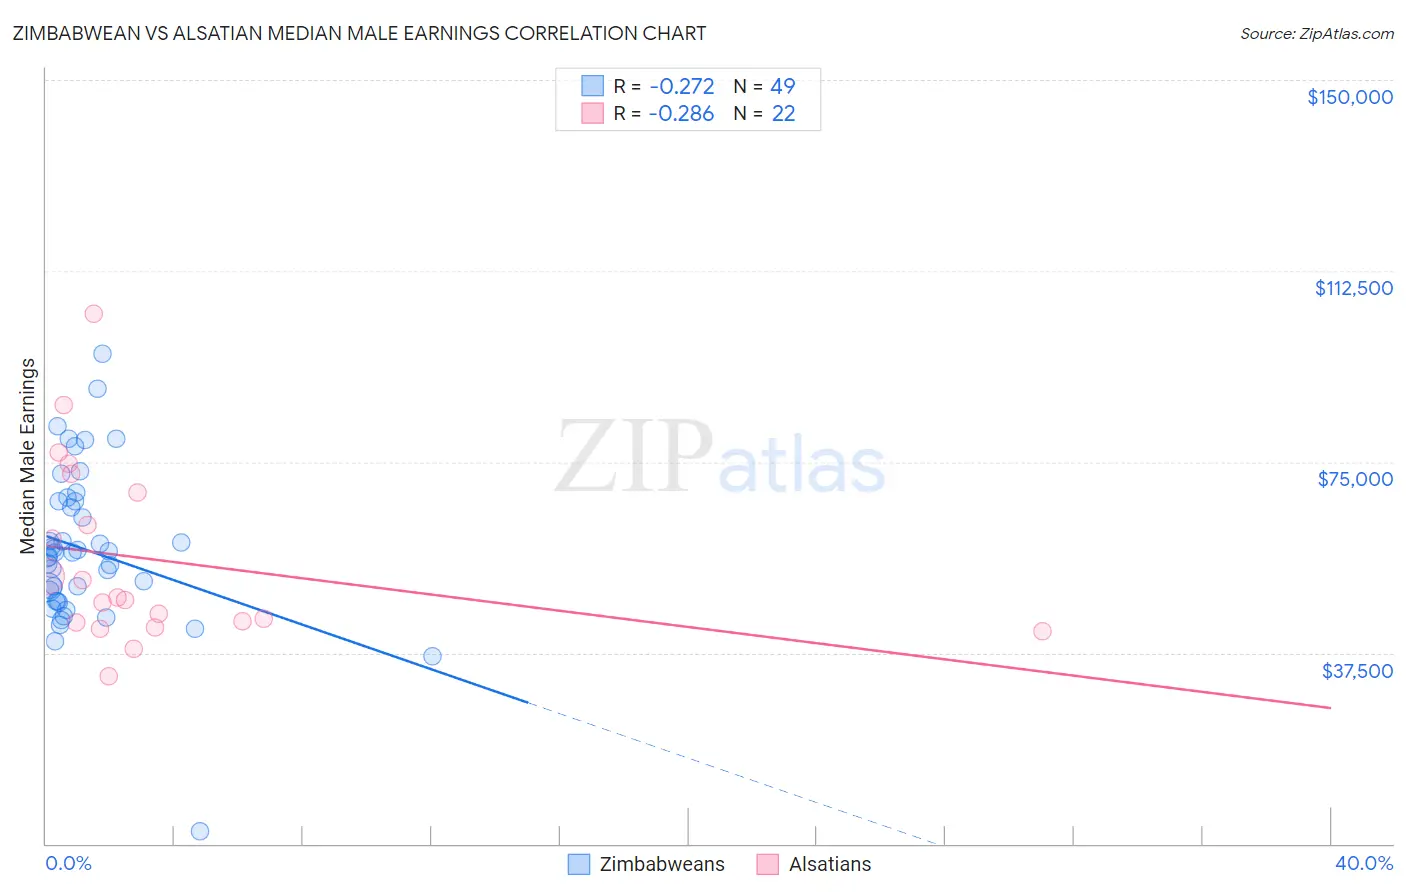
Zimbabwean vs Alsatian Median Male Earnings Correlation Chart
The statistical analysis conducted on geographies consisting of 69,206,147 people shows a weak negative correlation between the proportion of Zimbabweans and median male earnings in the United States with a correlation coefficient (R) of -0.272 and weighted average of $56,302. Similarly, the statistical analysis conducted on geographies consisting of 82,669,141 people shows a weak negative correlation between the proportion of Alsatians and median male earnings in the United States with a correlation coefficient (R) of -0.286 and weighted average of $55,380, a difference of 1.7%.
Median Male Earnings Correlation Summary
| Measurement | Zimbabwean | Alsatian |
| Minimum | $2,499 | $33,005 |
| Maximum | $96,250 | $104,004 |
| Range | $93,751 | $70,999 |
| Mean | $57,721 | $55,815 |
| Median | $57,093 | $48,104 |
| Interquartile 25% (IQ1) | $47,581 | $43,478 |
| Interquartile 75% (IQ3) | $67,190 | $69,063 |
| Interquartile Range (IQR) | $19,609 | $25,585 |
| Standard Deviation (Sample) | $15,546 | $17,889 |
| Standard Deviation (Population) | $15,387 | $17,478 |
Demographics Similar to Zimbabweans and Alsatians by Median Male Earnings
In terms of median male earnings, the demographic groups most similar to Zimbabweans are Luxembourger ($56,300, a difference of 0.0%), Danish ($56,246, a difference of 0.10%), Ethiopian ($56,243, a difference of 0.10%), Sri Lankan ($56,136, a difference of 0.29%), and Immigrants from Uganda ($56,064, a difference of 0.42%). Similarly, the demographic groups most similar to Alsatians are Czechoslovakian ($55,382, a difference of 0.0%), Icelander ($55,415, a difference of 0.060%), Immigrants from Ethiopia ($55,434, a difference of 0.10%), Scandinavian ($55,527, a difference of 0.26%), and Taiwanese ($55,556, a difference of 0.32%).
| Demographics | Rating | Rank | Median Male Earnings |
| Zimbabweans | 85.5 /100 | #139 | Excellent $56,302 |
| Luxembourgers | 85.5 /100 | #140 | Excellent $56,300 |
| Danes | 84.8 /100 | #141 | Excellent $56,246 |
| Ethiopians | 84.8 /100 | #142 | Excellent $56,243 |
| Sri Lankans | 83.4 /100 | #143 | Excellent $56,136 |
| Immigrants | Uganda | 82.4 /100 | #144 | Excellent $56,064 |
| Norwegians | 80.9 /100 | #145 | Excellent $55,965 |
| Immigrants | Chile | 80.7 /100 | #146 | Excellent $55,954 |
| Immigrants | Philippines | 78.4 /100 | #147 | Good $55,809 |
| Scottish | 78.2 /100 | #148 | Good $55,793 |
| English | 77.4 /100 | #149 | Good $55,747 |
| Swiss | 77.1 /100 | #150 | Good $55,731 |
| Immigrants | Oceania | 76.8 /100 | #151 | Good $55,712 |
| Peruvians | 75.8 /100 | #152 | Good $55,659 |
| Immigrants | Nepal | 75.0 /100 | #153 | Good $55,615 |
| Taiwanese | 73.9 /100 | #154 | Good $55,556 |
| Scandinavians | 73.4 /100 | #155 | Good $55,527 |
| Immigrants | Ethiopia | 71.6 /100 | #156 | Good $55,434 |
| Icelanders | 71.2 /100 | #157 | Good $55,415 |
| Czechoslovakians | 70.5 /100 | #158 | Good $55,382 |
| Alsatians | 70.5 /100 | #159 | Good $55,380 |