Immigrants from Kuwait vs Immigrants from Africa Median Male Earnings
COMPARE
Immigrants from Kuwait
Immigrants from Africa
Median Male Earnings
Median Male Earnings Comparison
Immigrants from Kuwait
Immigrants from Africa
$57,562
MEDIAN MALE EARNINGS
95.3/ 100
METRIC RATING
114th/ 347
METRIC RANK
$53,457
MEDIAN MALE EARNINGS
26.6/ 100
METRIC RATING
196th/ 347
METRIC RANK
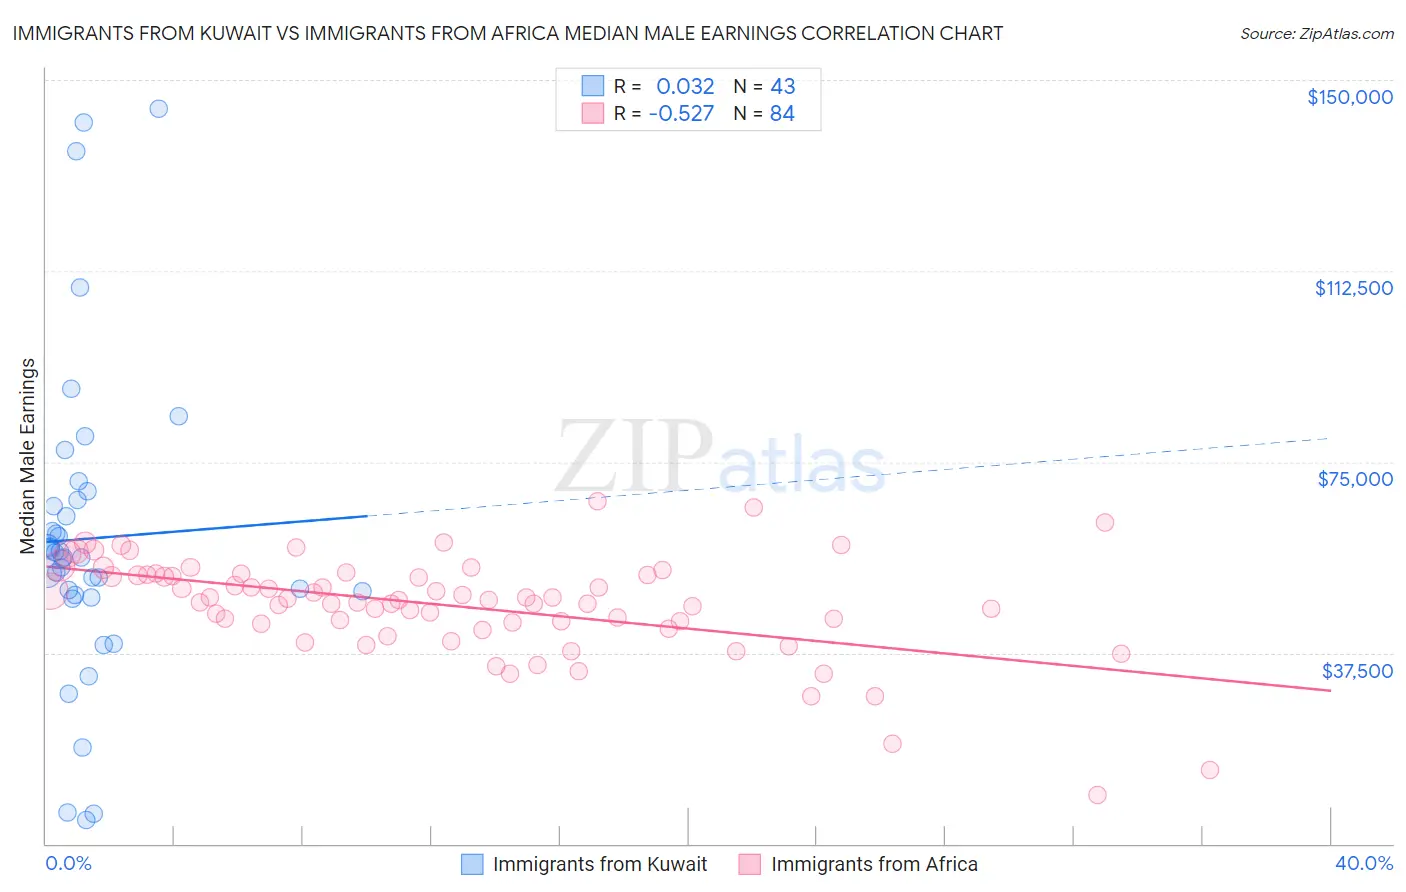
Immigrants from Kuwait vs Immigrants from Africa Median Male Earnings Correlation Chart
The statistical analysis conducted on geographies consisting of 136,917,085 people shows no correlation between the proportion of Immigrants from Kuwait and median male earnings in the United States with a correlation coefficient (R) of 0.032 and weighted average of $57,562. Similarly, the statistical analysis conducted on geographies consisting of 469,220,260 people shows a substantial negative correlation between the proportion of Immigrants from Africa and median male earnings in the United States with a correlation coefficient (R) of -0.527 and weighted average of $53,457, a difference of 7.7%.
Median Male Earnings Correlation Summary
| Measurement | Immigrants from Kuwait | Immigrants from Africa |
| Minimum | $4,638 | $9,467 |
| Maximum | $144,236 | $67,337 |
| Range | $139,598 | $57,870 |
| Mean | $59,941 | $46,791 |
| Median | $56,335 | $47,827 |
| Interquartile 25% (IQ1) | $48,946 | $43,316 |
| Interquartile 75% (IQ3) | $67,515 | $52,867 |
| Interquartile Range (IQR) | $18,568 | $9,551 |
| Standard Deviation (Sample) | $30,286 | $9,958 |
| Standard Deviation (Population) | $29,932 | $9,899 |
Similar Demographics by Median Male Earnings
Demographics Similar to Immigrants from Kuwait by Median Male Earnings
In terms of median male earnings, the demographic groups most similar to Immigrants from Kuwait are Carpatho Rusyn ($57,572, a difference of 0.020%), Immigrants from Afghanistan ($57,582, a difference of 0.040%), European ($57,637, a difference of 0.13%), Swedish ($57,445, a difference of 0.20%), and Lebanese ($57,409, a difference of 0.27%).
| Demographics | Rating | Rank | Median Male Earnings |
| Serbians | 96.8 /100 | #107 | Exceptional $57,975 |
| Immigrants | Uzbekistan | 96.7 /100 | #108 | Exceptional $57,941 |
| British | 96.5 /100 | #109 | Exceptional $57,890 |
| Palestinians | 96.2 /100 | #110 | Exceptional $57,778 |
| Europeans | 95.6 /100 | #111 | Exceptional $57,637 |
| Immigrants | Afghanistan | 95.4 /100 | #112 | Exceptional $57,582 |
| Carpatho Rusyns | 95.3 /100 | #113 | Exceptional $57,572 |
| Immigrants | Kuwait | 95.3 /100 | #114 | Exceptional $57,562 |
| Swedes | 94.8 /100 | #115 | Exceptional $57,445 |
| Lebanese | 94.6 /100 | #116 | Exceptional $57,409 |
| Immigrants | Zimbabwe | 94.3 /100 | #117 | Exceptional $57,352 |
| Hungarians | 94.0 /100 | #118 | Exceptional $57,309 |
| Arabs | 94.0 /100 | #119 | Exceptional $57,298 |
| Canadians | 93.9 /100 | #120 | Exceptional $57,286 |
| Immigrants | Albania | 93.3 /100 | #121 | Exceptional $57,179 |
Demographics Similar to Immigrants from Africa by Median Male Earnings
In terms of median male earnings, the demographic groups most similar to Immigrants from Africa are Immigrants from Kenya ($53,427, a difference of 0.060%), Immigrants from the Azores ($53,503, a difference of 0.090%), Spanish ($53,576, a difference of 0.22%), Kenyan ($53,647, a difference of 0.36%), and Guamanian/Chamorro ($53,661, a difference of 0.38%).
| Demographics | Rating | Rank | Median Male Earnings |
| Puget Sound Salish | 31.6 /100 | #189 | Fair $53,704 |
| Uruguayans | 31.1 /100 | #190 | Fair $53,680 |
| Guamanians/Chamorros | 30.7 /100 | #191 | Fair $53,661 |
| Scotch-Irish | 30.6 /100 | #192 | Fair $53,658 |
| Kenyans | 30.4 /100 | #193 | Fair $53,647 |
| Spanish | 29.0 /100 | #194 | Fair $53,576 |
| Immigrants | Azores | 27.5 /100 | #195 | Fair $53,503 |
| Immigrants | Africa | 26.6 /100 | #196 | Fair $53,457 |
| Immigrants | Kenya | 26.0 /100 | #197 | Fair $53,427 |
| Immigrants | Costa Rica | 22.6 /100 | #198 | Fair $53,237 |
| Tongans | 22.3 /100 | #199 | Fair $53,218 |
| Immigrants | Thailand | 17.5 /100 | #200 | Poor $52,908 |
| Immigrants | Bosnia and Herzegovina | 16.9 /100 | #201 | Poor $52,869 |
| Immigrants | Uruguay | 16.8 /100 | #202 | Poor $52,860 |
| Panamanians | 16.5 /100 | #203 | Poor $52,835 |