Yuman vs Yaqui 1 or more Vehicles in Household
COMPARE
Yuman
Yaqui
1 or more Vehicles in Household
1 or more Vehicles in Household Comparison
Yuman
Yaqui
85.5%
1 OR MORE VEHICLES IN HOUSEHOLD
0.0/ 100
METRIC RATING
299th/ 347
METRIC RANK
92.6%
1 OR MORE VEHICLES IN HOUSEHOLD
100.0/ 100
METRIC RATING
24th/ 347
METRIC RANK
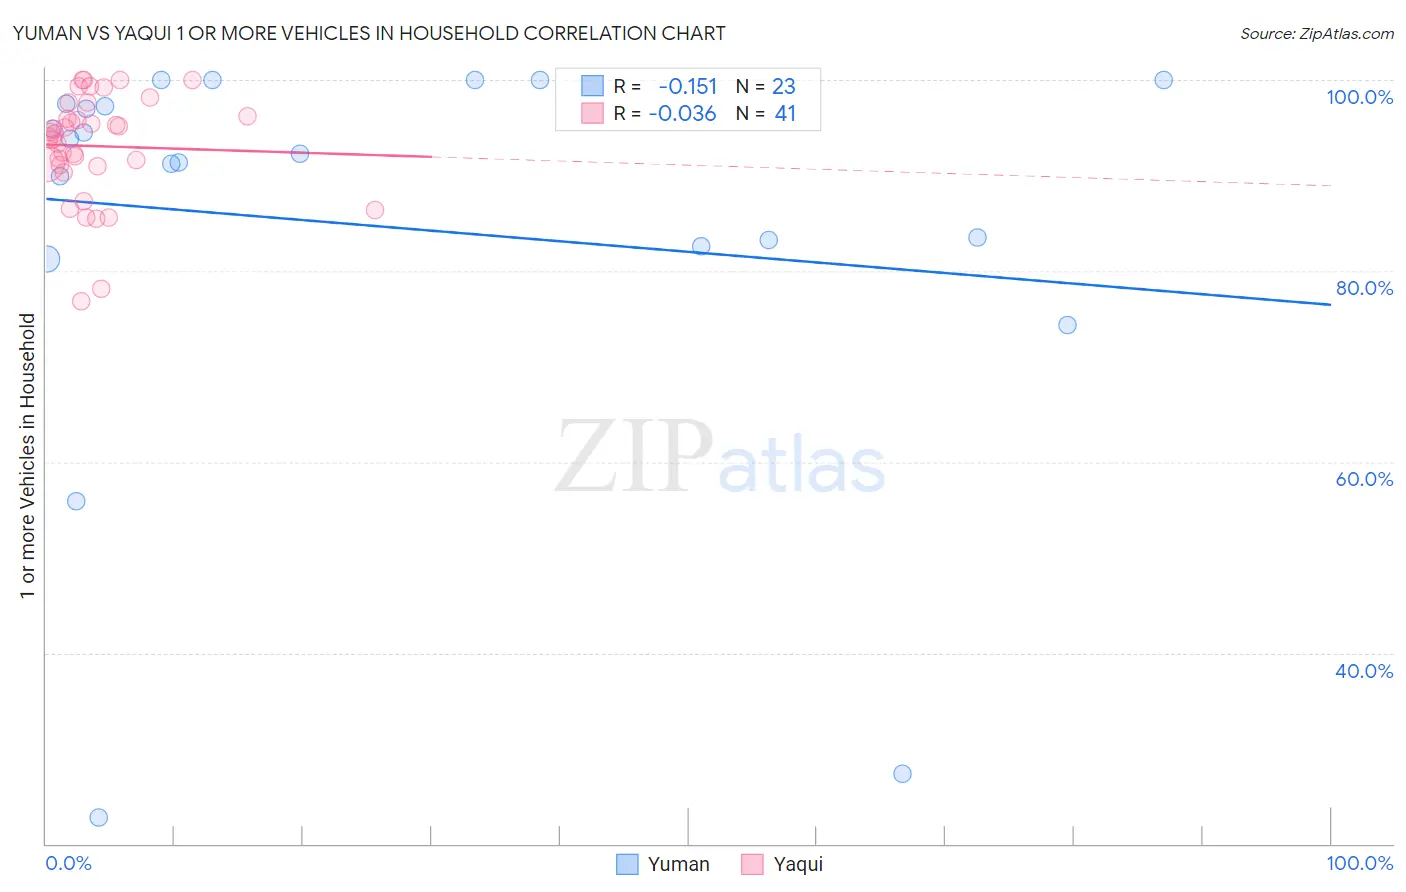
Yuman vs Yaqui 1 or more Vehicles in Household Correlation Chart
The statistical analysis conducted on geographies consisting of 40,663,643 people shows a poor negative correlation between the proportion of Yuman and percentage of households with 1 or more vehicles available in the United States with a correlation coefficient (R) of -0.151 and weighted average of 85.5%. Similarly, the statistical analysis conducted on geographies consisting of 107,720,236 people shows no correlation between the proportion of Yaqui and percentage of households with 1 or more vehicles available in the United States with a correlation coefficient (R) of -0.036 and weighted average of 92.6%, a difference of 8.3%.
1 or more Vehicles in Household Correlation Summary
| Measurement | Yuman | Yaqui |
| Minimum | 22.7% | 76.8% |
| Maximum | 100.0% | 100.0% |
| Range | 77.3% | 23.2% |
| Mean | 84.8% | 93.1% |
| Median | 92.3% | 94.4% |
| Interquartile 25% (IQ1) | 82.6% | 91.1% |
| Interquartile 75% (IQ3) | 97.5% | 96.9% |
| Interquartile Range (IQR) | 14.8% | 5.8% |
| Standard Deviation (Sample) | 21.5% | 5.6% |
| Standard Deviation (Population) | 21.1% | 5.5% |
Similar Demographics by 1 or more Vehicles in Household
Demographics Similar to Yuman by 1 or more Vehicles in Household
In terms of 1 or more vehicles in household, the demographic groups most similar to Yuman are Immigrants from Russia (85.4%, a difference of 0.0%), Immigrants from Panama (85.4%, a difference of 0.050%), Moroccan (85.4%, a difference of 0.070%), Immigrants from Greece (85.4%, a difference of 0.10%), and Belizean (85.7%, a difference of 0.24%).
| Demographics | Rating | Rank | 1 or more Vehicles in Household |
| Okinawans | 0.0 /100 | #292 | Tragic 86.1% |
| Indians (Asian) | 0.0 /100 | #293 | Tragic 86.0% |
| Alaskan Athabascans | 0.0 /100 | #294 | Tragic 86.0% |
| Immigrants | Jamaica | 0.0 /100 | #295 | Tragic 85.8% |
| Immigrants | Spain | 0.0 /100 | #296 | Tragic 85.8% |
| Paraguayans | 0.0 /100 | #297 | Tragic 85.7% |
| Belizeans | 0.0 /100 | #298 | Tragic 85.7% |
| Yuman | 0.0 /100 | #299 | Tragic 85.5% |
| Immigrants | Russia | 0.0 /100 | #300 | Tragic 85.4% |
| Immigrants | Panama | 0.0 /100 | #301 | Tragic 85.4% |
| Moroccans | 0.0 /100 | #302 | Tragic 85.4% |
| Immigrants | Greece | 0.0 /100 | #303 | Tragic 85.4% |
| Immigrants | Ukraine | 0.0 /100 | #304 | Tragic 85.2% |
| Immigrants | China | 0.0 /100 | #305 | Tragic 84.9% |
| Immigrants | Western Africa | 0.0 /100 | #306 | Tragic 84.9% |
Demographics Similar to Yaqui by 1 or more Vehicles in Household
In terms of 1 or more vehicles in household, the demographic groups most similar to Yaqui are Immigrants from Iraq (92.5%, a difference of 0.020%), British (92.5%, a difference of 0.040%), Nepalese (92.6%, a difference of 0.070%), American (92.5%, a difference of 0.090%), and Sri Lankan (92.5%, a difference of 0.12%).
| Demographics | Rating | Rank | 1 or more Vehicles in Household |
| Europeans | 100.0 /100 | #17 | Exceptional 93.0% |
| Welsh | 100.0 /100 | #18 | Exceptional 93.0% |
| Tongans | 100.0 /100 | #19 | Exceptional 92.9% |
| Arapaho | 100.0 /100 | #20 | Exceptional 92.7% |
| Ottawa | 100.0 /100 | #21 | Exceptional 92.7% |
| French | 100.0 /100 | #22 | Exceptional 92.7% |
| Nepalese | 100.0 /100 | #23 | Exceptional 92.6% |
| Yaqui | 100.0 /100 | #24 | Exceptional 92.6% |
| Immigrants | Iraq | 100.0 /100 | #25 | Exceptional 92.5% |
| British | 100.0 /100 | #26 | Exceptional 92.5% |
| Americans | 100.0 /100 | #27 | Exceptional 92.5% |
| Sri Lankans | 100.0 /100 | #28 | Exceptional 92.5% |
| Native Hawaiians | 100.0 /100 | #29 | Exceptional 92.4% |
| Finns | 100.0 /100 | #30 | Exceptional 92.4% |
| Samoans | 100.0 /100 | #31 | Exceptional 92.4% |