Yuman vs Yaqui 10th Grade
COMPARE
Yuman
Yaqui
10th Grade
10th Grade Comparison
Yuman
Yaqui
92.0%
10TH GRADE
0.0/ 100
METRIC RATING
286th/ 347
METRIC RANK
91.1%
10TH GRADE
0.0/ 100
METRIC RATING
306th/ 347
METRIC RANK
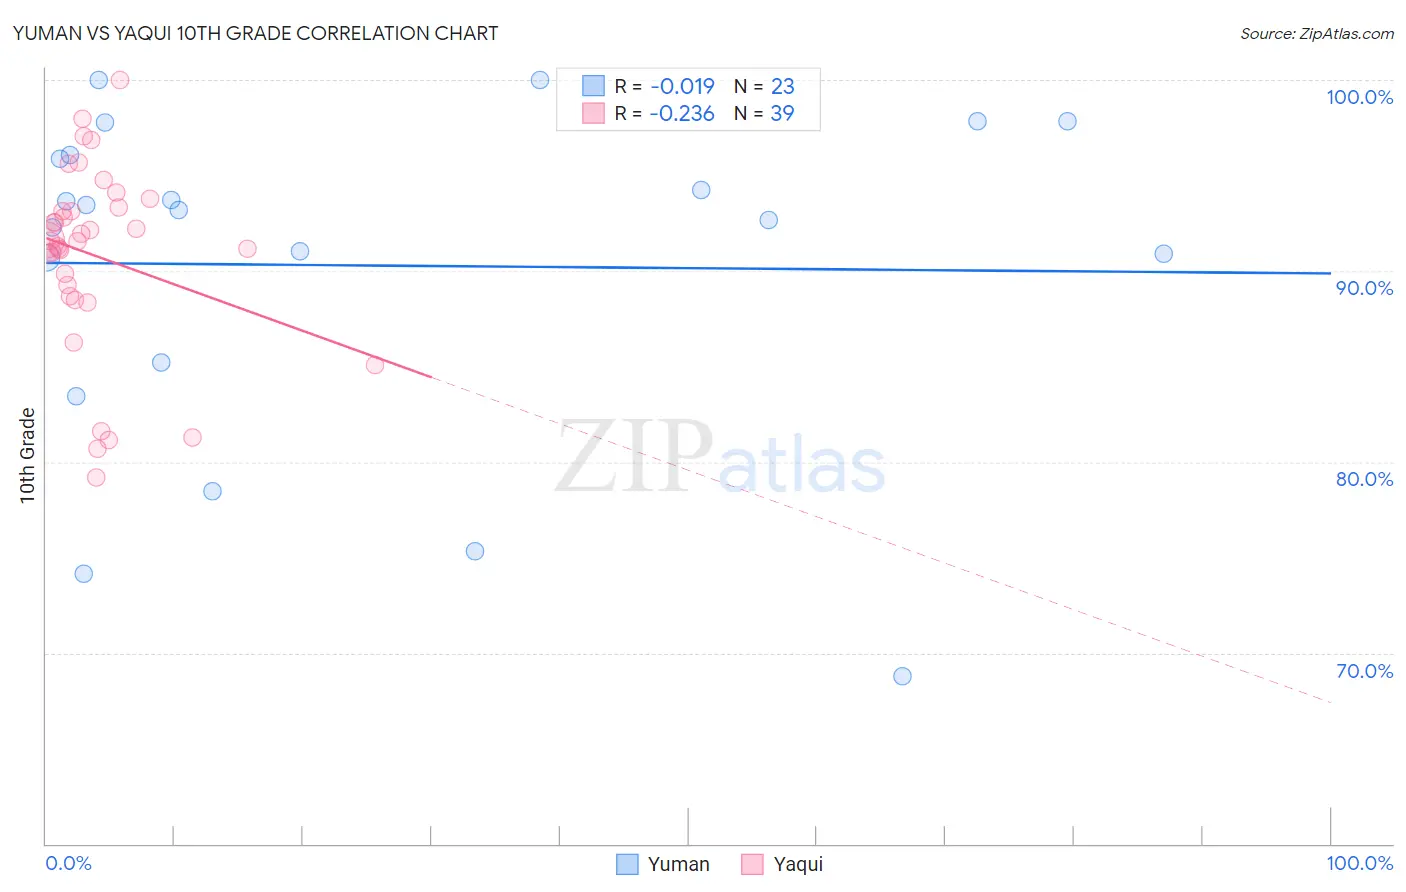
Yuman vs Yaqui 10th Grade Correlation Chart
The statistical analysis conducted on geographies consisting of 40,696,349 people shows no correlation between the proportion of Yuman and percentage of population with at least 10th grade education in the United States with a correlation coefficient (R) of -0.019 and weighted average of 92.0%. Similarly, the statistical analysis conducted on geographies consisting of 107,725,021 people shows a weak negative correlation between the proportion of Yaqui and percentage of population with at least 10th grade education in the United States with a correlation coefficient (R) of -0.236 and weighted average of 91.1%, a difference of 1.0%.
10th Grade Correlation Summary
| Measurement | Yuman | Yaqui |
| Minimum | 68.8% | 79.2% |
| Maximum | 100.0% | 100.0% |
| Range | 31.2% | 20.8% |
| Mean | 90.3% | 90.8% |
| Median | 93.2% | 91.6% |
| Interquartile 25% (IQ1) | 85.2% | 88.7% |
| Interquartile 75% (IQ3) | 96.0% | 93.3% |
| Interquartile Range (IQR) | 10.8% | 4.7% |
| Standard Deviation (Sample) | 8.7% | 4.9% |
| Standard Deviation (Population) | 8.5% | 4.8% |
Demographics Similar to Yuman and Yaqui by 10th Grade
In terms of 10th grade, the demographic groups most similar to Yuman are Pennsylvania German (91.9%, a difference of 0.15%), Immigrants from Laos (91.9%, a difference of 0.15%), Sri Lankan (91.8%, a difference of 0.19%), British West Indian (91.8%, a difference of 0.22%), and Immigrants from West Indies (91.8%, a difference of 0.22%). Similarly, the demographic groups most similar to Yaqui are Immigrants from Dominica (91.1%, a difference of 0.060%), Pima (91.2%, a difference of 0.080%), Immigrants from Vietnam (91.2%, a difference of 0.13%), Immigrants from Guyana (91.2%, a difference of 0.15%), and Japanese (91.2%, a difference of 0.16%).
| Demographics | Rating | Rank | 10th Grade |
| Yuman | 0.0 /100 | #286 | Tragic 92.0% |
| Pennsylvania Germans | 0.0 /100 | #287 | Tragic 91.9% |
| Immigrants | Laos | 0.0 /100 | #288 | Tragic 91.9% |
| Sri Lankans | 0.0 /100 | #289 | Tragic 91.8% |
| British West Indians | 0.0 /100 | #290 | Tragic 91.8% |
| Immigrants | West Indies | 0.0 /100 | #291 | Tragic 91.8% |
| Immigrants | Burma/Myanmar | 0.0 /100 | #292 | Tragic 91.8% |
| Indonesians | 0.0 /100 | #293 | Tragic 91.8% |
| Haitians | 0.0 /100 | #294 | Tragic 91.8% |
| Lumbee | 0.0 /100 | #295 | Tragic 91.7% |
| Immigrants | Grenada | 0.0 /100 | #296 | Tragic 91.6% |
| Fijians | 0.0 /100 | #297 | Tragic 91.5% |
| Cubans | 0.0 /100 | #298 | Tragic 91.5% |
| Immigrants | Haiti | 0.0 /100 | #299 | Tragic 91.4% |
| Guyanese | 0.0 /100 | #300 | Tragic 91.4% |
| Japanese | 0.0 /100 | #301 | Tragic 91.2% |
| Immigrants | Guyana | 0.0 /100 | #302 | Tragic 91.2% |
| Immigrants | Vietnam | 0.0 /100 | #303 | Tragic 91.2% |
| Pima | 0.0 /100 | #304 | Tragic 91.2% |
| Immigrants | Dominica | 0.0 /100 | #305 | Tragic 91.1% |
| Yaqui | 0.0 /100 | #306 | Tragic 91.1% |