Yuman vs Yaqui Disability Age 65 to 74
COMPARE
Yuman
Yaqui
Disability Age 65 to 74
Disability Age 65 to 74 Comparison
Yuman
Yaqui
31.5%
DISABILITY AGE 65 TO 74
0.0/ 100
METRIC RATING
336th/ 347
METRIC RANK
27.4%
DISABILITY AGE 65 TO 74
0.0/ 100
METRIC RATING
309th/ 347
METRIC RANK
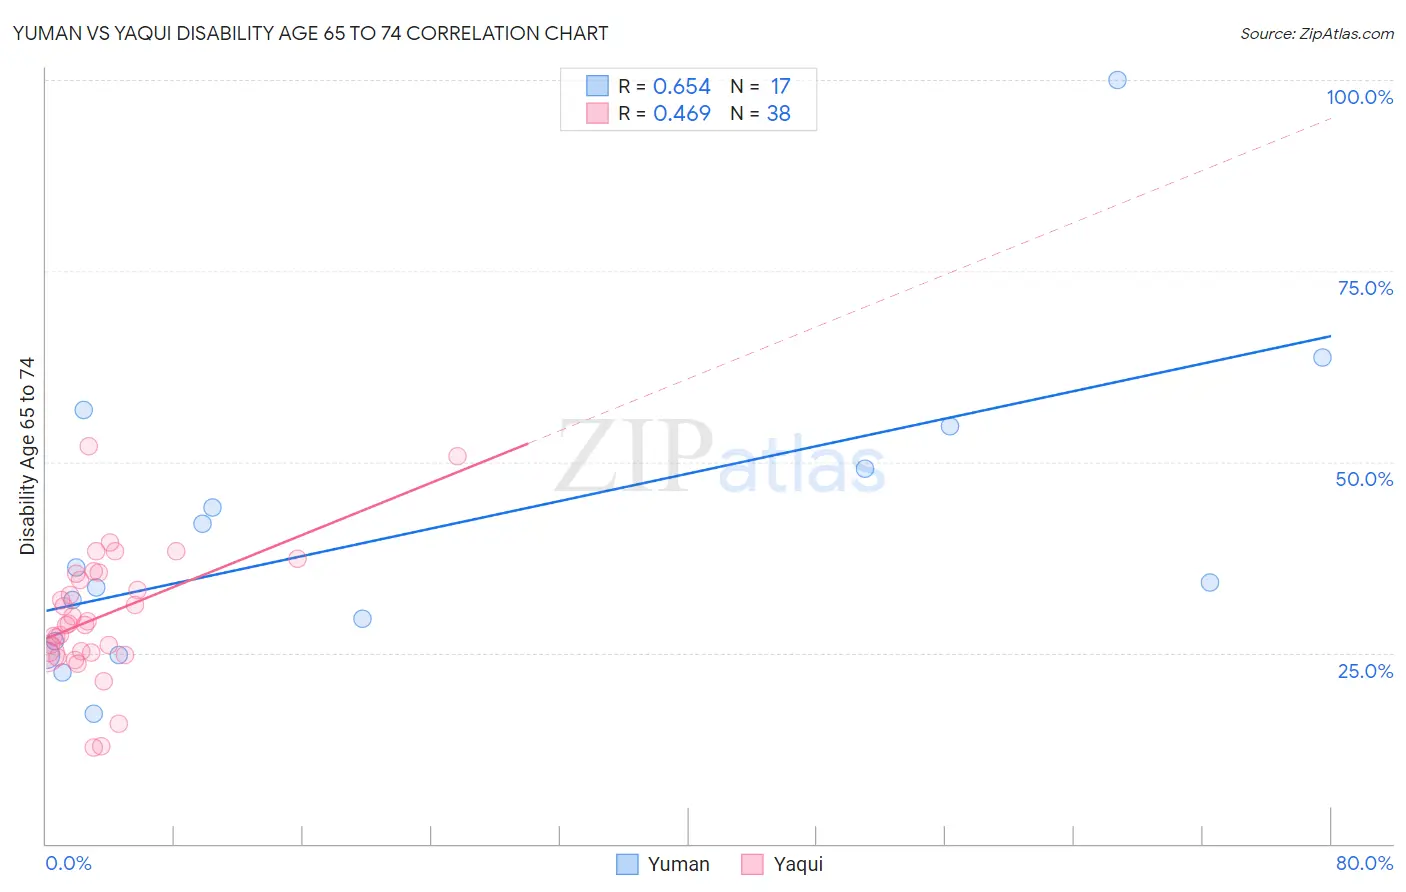
Yuman vs Yaqui Disability Age 65 to 74 Correlation Chart
The statistical analysis conducted on geographies consisting of 40,592,488 people shows a significant positive correlation between the proportion of Yuman and percentage of population with a disability between the ages 65 and 75 in the United States with a correlation coefficient (R) of 0.654 and weighted average of 31.5%. Similarly, the statistical analysis conducted on geographies consisting of 107,674,175 people shows a moderate positive correlation between the proportion of Yaqui and percentage of population with a disability between the ages 65 and 75 in the United States with a correlation coefficient (R) of 0.469 and weighted average of 27.4%, a difference of 15.0%.
Disability Age 65 to 74 Correlation Summary
| Measurement | Yuman | Yaqui |
| Minimum | 17.1% | 12.5% |
| Maximum | 100.0% | 52.0% |
| Range | 82.9% | 39.5% |
| Mean | 40.6% | 29.8% |
| Median | 34.2% | 28.7% |
| Interquartile 25% (IQ1) | 25.6% | 25.0% |
| Interquartile 75% (IQ3) | 51.9% | 35.4% |
| Interquartile Range (IQR) | 26.3% | 10.4% |
| Standard Deviation (Sample) | 20.2% | 8.4% |
| Standard Deviation (Population) | 19.6% | 8.2% |
Similar Demographics by Disability Age 65 to 74
Demographics Similar to Yuman by Disability Age 65 to 74
In terms of disability age 65 to 74, the demographic groups most similar to Yuman are Cheyenne (31.1%, a difference of 1.3%), Houma (32.3%, a difference of 2.6%), Alaskan Athabascan (32.4%, a difference of 2.8%), Alaska Native (30.6%, a difference of 2.8%), and Colville (30.5%, a difference of 3.1%).
| Demographics | Rating | Rank | Disability Age 65 to 74 |
| Choctaw | 0.0 /100 | #329 | Tragic 30.2% |
| Creek | 0.0 /100 | #330 | Tragic 30.2% |
| Chickasaw | 0.0 /100 | #331 | Tragic 30.2% |
| Natives/Alaskans | 0.0 /100 | #332 | Tragic 30.4% |
| Colville | 0.0 /100 | #333 | Tragic 30.5% |
| Alaska Natives | 0.0 /100 | #334 | Tragic 30.6% |
| Cheyenne | 0.0 /100 | #335 | Tragic 31.1% |
| Yuman | 0.0 /100 | #336 | Tragic 31.5% |
| Houma | 0.0 /100 | #337 | Tragic 32.3% |
| Alaskan Athabascans | 0.0 /100 | #338 | Tragic 32.4% |
| Kiowa | 0.0 /100 | #339 | Tragic 32.6% |
| Lumbee | 0.0 /100 | #340 | Tragic 32.7% |
| Tsimshian | 0.0 /100 | #341 | Tragic 32.9% |
| Pueblo | 0.0 /100 | #342 | Tragic 33.1% |
| Navajo | 0.0 /100 | #343 | Tragic 33.3% |
Demographics Similar to Yaqui by Disability Age 65 to 74
In terms of disability age 65 to 74, the demographic groups most similar to Yaqui are Shoshone (27.4%, a difference of 0.050%), Sioux (27.3%, a difference of 0.060%), Ute (27.3%, a difference of 0.21%), Black/African American (27.3%, a difference of 0.27%), and Menominee (27.4%, a difference of 0.27%).
| Demographics | Rating | Rank | Disability Age 65 to 74 |
| Central American Indians | 0.0 /100 | #302 | Tragic 27.1% |
| Tlingit-Haida | 0.0 /100 | #303 | Tragic 27.1% |
| Puget Sound Salish | 0.0 /100 | #304 | Tragic 27.2% |
| Mexicans | 0.0 /100 | #305 | Tragic 27.2% |
| Blacks/African Americans | 0.0 /100 | #306 | Tragic 27.3% |
| Ute | 0.0 /100 | #307 | Tragic 27.3% |
| Sioux | 0.0 /100 | #308 | Tragic 27.3% |
| Yaqui | 0.0 /100 | #309 | Tragic 27.4% |
| Shoshone | 0.0 /100 | #310 | Tragic 27.4% |
| Menominee | 0.0 /100 | #311 | Tragic 27.4% |
| Osage | 0.0 /100 | #312 | Tragic 27.5% |
| Paiute | 0.0 /100 | #313 | Tragic 27.8% |
| Chippewa | 0.0 /100 | #314 | Tragic 27.8% |
| Cajuns | 0.0 /100 | #315 | Tragic 27.9% |
| Crow | 0.0 /100 | #316 | Tragic 27.9% |