Yaqui vs Nicaraguan Median Female Earnings
COMPARE
Yaqui
Nicaraguan
Median Female Earnings
Median Female Earnings Comparison
Yaqui
Nicaraguans
$34,943
MEDIAN FEMALE EARNINGS
0.0/ 100
METRIC RATING
312th/ 347
METRIC RANK
$36,904
MEDIAN FEMALE EARNINGS
0.3/ 100
METRIC RATING
271st/ 347
METRIC RANK
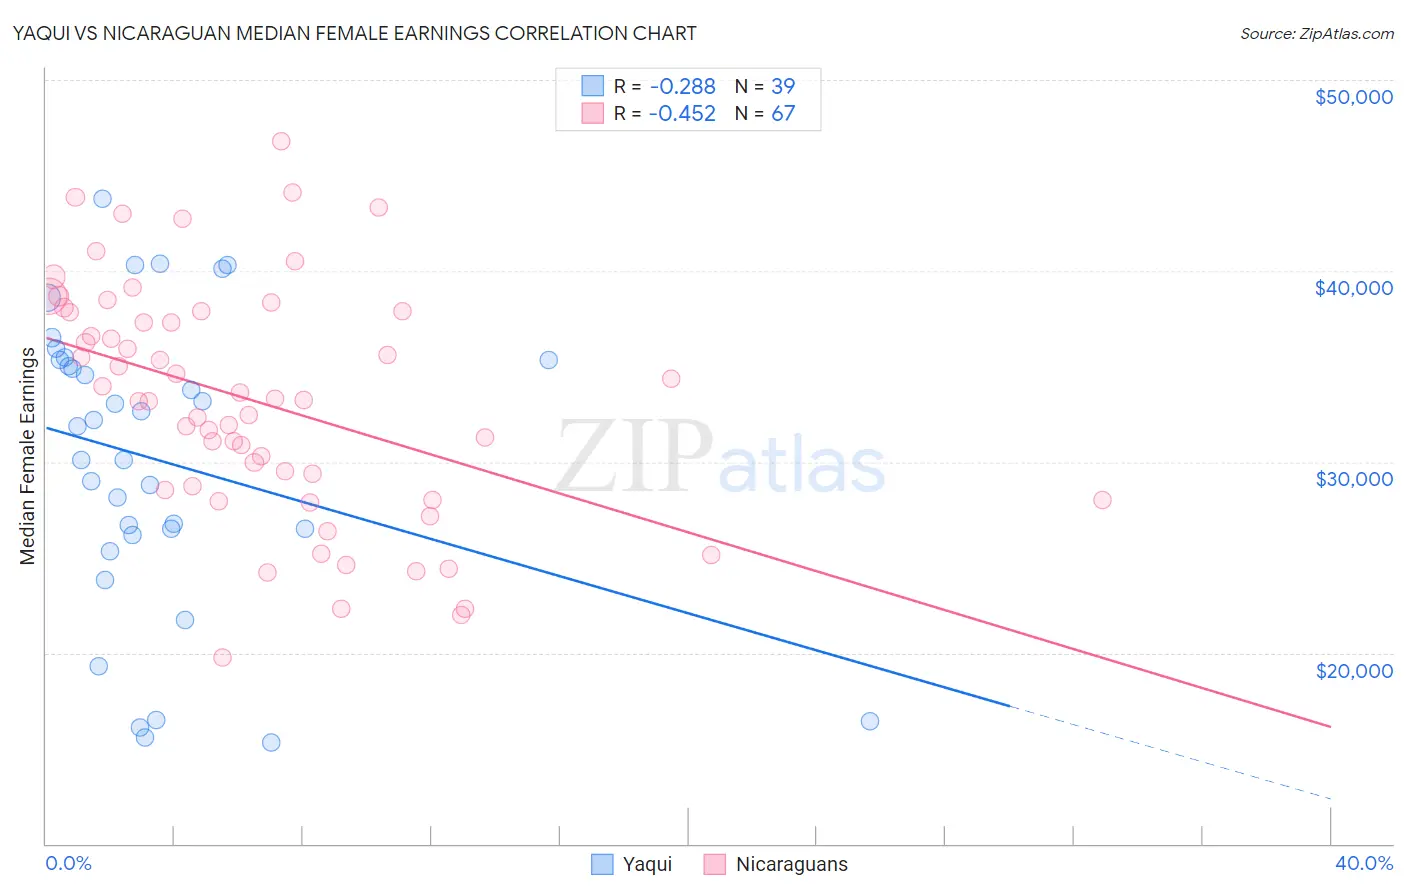
Yaqui vs Nicaraguan Median Female Earnings Correlation Chart
The statistical analysis conducted on geographies consisting of 107,698,351 people shows a weak negative correlation between the proportion of Yaqui and median female earnings in the United States with a correlation coefficient (R) of -0.288 and weighted average of $34,943. Similarly, the statistical analysis conducted on geographies consisting of 285,562,619 people shows a moderate negative correlation between the proportion of Nicaraguans and median female earnings in the United States with a correlation coefficient (R) of -0.452 and weighted average of $36,904, a difference of 5.6%.
Median Female Earnings Correlation Summary
| Measurement | Yaqui | Nicaraguan |
| Minimum | $15,284 | $19,750 |
| Maximum | $43,787 | $46,802 |
| Range | $28,503 | $27,052 |
| Mean | $30,052 | $33,153 |
| Median | $31,854 | $33,262 |
| Interquartile 25% (IQ1) | $26,190 | $28,501 |
| Interquartile 75% (IQ3) | $35,336 | $37,900 |
| Interquartile Range (IQR) | $9,146 | $9,399 |
| Standard Deviation (Sample) | $7,719 | $6,142 |
| Standard Deviation (Population) | $7,619 | $6,096 |
Similar Demographics by Median Female Earnings
Demographics Similar to Yaqui by Median Female Earnings
In terms of median female earnings, the demographic groups most similar to Yaqui are Cuban ($34,942, a difference of 0.0%), Ute ($34,960, a difference of 0.050%), Apache ($34,895, a difference of 0.14%), Chippewa ($35,003, a difference of 0.17%), and Honduran ($35,013, a difference of 0.20%).
| Demographics | Rating | Rank | Median Female Earnings |
| Bahamians | 0.0 /100 | #305 | Tragic $35,125 |
| Fijians | 0.0 /100 | #306 | Tragic $35,114 |
| Sioux | 0.0 /100 | #307 | Tragic $35,063 |
| Immigrants | Bahamas | 0.0 /100 | #308 | Tragic $35,027 |
| Hondurans | 0.0 /100 | #309 | Tragic $35,013 |
| Chippewa | 0.0 /100 | #310 | Tragic $35,003 |
| Ute | 0.0 /100 | #311 | Tragic $34,960 |
| Yaqui | 0.0 /100 | #312 | Tragic $34,943 |
| Cubans | 0.0 /100 | #313 | Tragic $34,942 |
| Apache | 0.0 /100 | #314 | Tragic $34,895 |
| Pennsylvania Germans | 0.0 /100 | #315 | Tragic $34,802 |
| Cherokee | 0.0 /100 | #316 | Tragic $34,742 |
| Potawatomi | 0.0 /100 | #317 | Tragic $34,739 |
| Immigrants | Yemen | 0.0 /100 | #318 | Tragic $34,693 |
| Shoshone | 0.0 /100 | #319 | Tragic $34,677 |
Demographics Similar to Nicaraguans by Median Female Earnings
In terms of median female earnings, the demographic groups most similar to Nicaraguans are French American Indian ($36,920, a difference of 0.040%), Immigrants from Dominican Republic ($36,857, a difference of 0.13%), Immigrants from Laos ($36,841, a difference of 0.17%), Immigrants from Venezuela ($37,003, a difference of 0.27%), and Cree ($37,018, a difference of 0.31%).
| Demographics | Rating | Rank | Median Female Earnings |
| Salvadorans | 0.4 /100 | #264 | Tragic $37,083 |
| Immigrants | Belize | 0.4 /100 | #265 | Tragic $37,056 |
| Dominicans | 0.4 /100 | #266 | Tragic $37,046 |
| Immigrants | Nonimmigrants | 0.4 /100 | #267 | Tragic $37,024 |
| Cree | 0.4 /100 | #268 | Tragic $37,018 |
| Immigrants | Venezuela | 0.4 /100 | #269 | Tragic $37,003 |
| French American Indians | 0.3 /100 | #270 | Tragic $36,920 |
| Nicaraguans | 0.3 /100 | #271 | Tragic $36,904 |
| Immigrants | Dominican Republic | 0.3 /100 | #272 | Tragic $36,857 |
| Immigrants | Laos | 0.3 /100 | #273 | Tragic $36,841 |
| Immigrants | El Salvador | 0.2 /100 | #274 | Tragic $36,673 |
| Africans | 0.1 /100 | #275 | Tragic $36,530 |
| Central Americans | 0.1 /100 | #276 | Tragic $36,492 |
| Marshallese | 0.1 /100 | #277 | Tragic $36,459 |
| U.S. Virgin Islanders | 0.1 /100 | #278 | Tragic $36,424 |